There have been some interesting developments in markets overnight, but on the whole equities and corporate credit have seen limited moves.
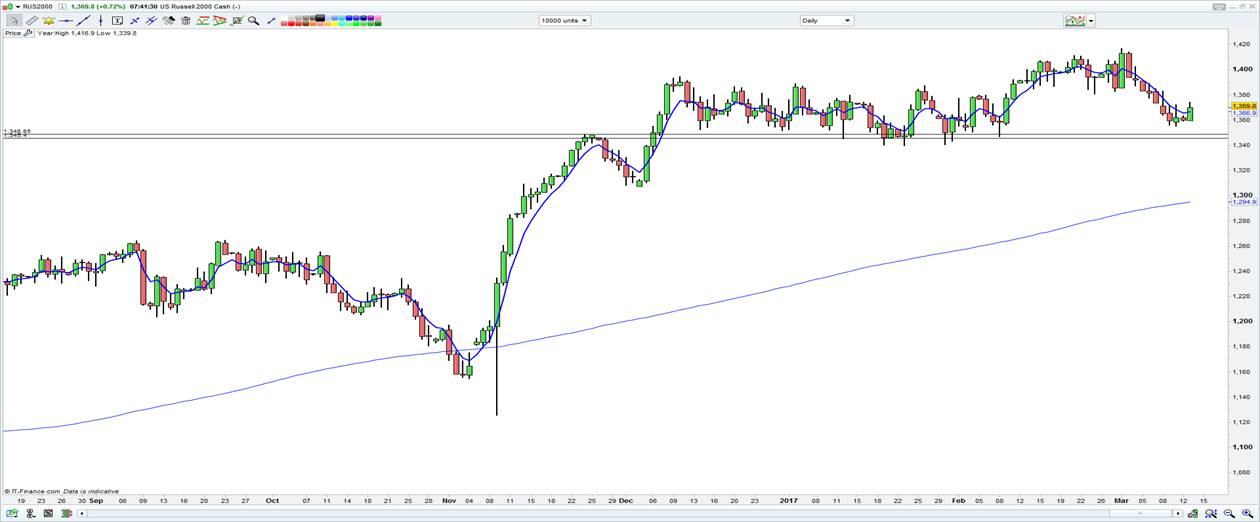
The S&P 500 and Dow Jones are largely unchanged, with small buying in materials and utilities, on volumes some 19% below the 30-day average. We have seen some very modest outperformance from small caps, with the Russell 2000 finding buyers, but the daily chart of the Russell 2000 should be on the radar given the possibility of a stronger downside move should we see a close below key horizontal support between 1348 and 1340. One for the radar as it would almost certainly affect sentiment towards the S&P 500 and Dow.

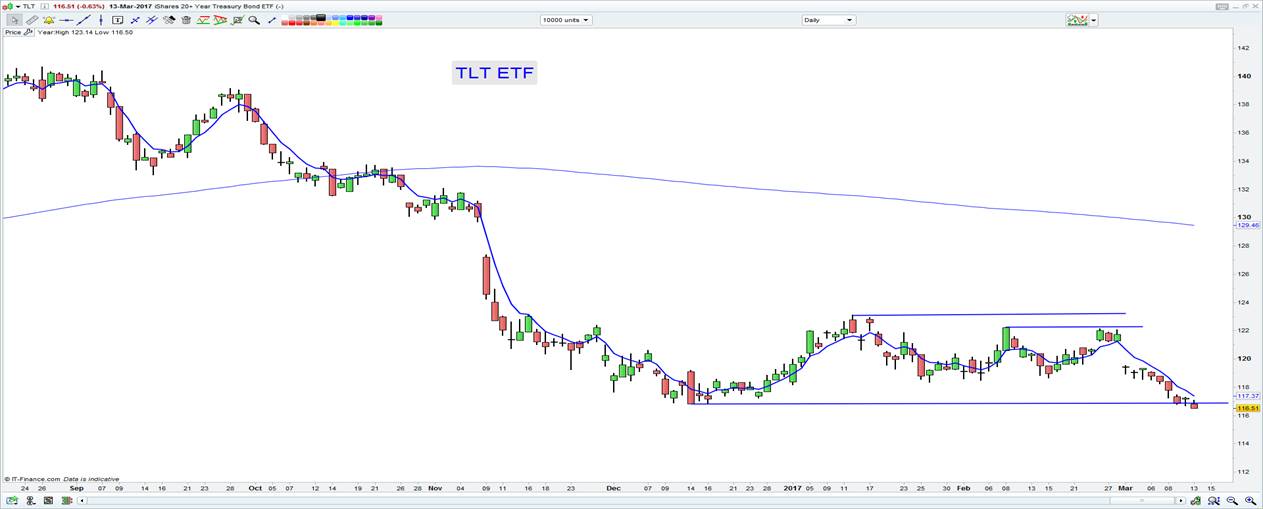
There has been some further selling in U.S. fixed income and we can see the five-year U.S. treasury eyeing a break of the 10 March high of 2.14%. A break here this week would certainly be positive for the USD, although specifically against the JPY. We can look at the TLT ETF (iShares 20+Year Treasury Bond ETF) as a way to play the moves in the bond market and here we can see price breaking below the December lows. Put this ETF on the radar as this break could be important and with the bears in control I feel the probability is this goes lower from here. Stops on short positions can be placed above 118.34.

I have really been focusing on the five-year U.S. treasury given it encapsulates the markets view on potential changes to the Fed’s outlook. This includes changes from the Fed (at this week’s central bank meet) in their forecast path for the Fed funds rate, which currently sit at 1.375% by end of 2017, 2.125% by the end of 2018 and 2.875% for the end of 2019.
The Fed also release its longer-term assumption of the fed funds rate, which sits at 3% and this call is really important for businesses who would use that in the discounting process to assess the net present value (NPV) of any further projects or investment. If there are greater relative returns to be had in other asset classes (in this case the bond market), it makes the hurdle rate to put money to work to invest and to expand the business that much higher.
Saying being said, we have had many years of zero interest rates and it’s only now that we are seeing signs of investment and capital expenditure.
Another focal point has been in the UK, where on one hand we are now hearing that Theresa May will not pull the trigger on Article 50 today (as speculated), but towards the end of the month. However, the bigger talking point has been Scottish National party leader Nicola Sturgeon expressing a view of calling a fresh referendum on Scottish independence between autumn 2018 and spring 2019. The timing here shouldn’t shock too greatly given the Scottish public should have a clearer picture of the outcome of Britain’s negations with the European Union (EU). As things stand different polls suggest different outcomes, but they are all fairly close. Of course, one consideration that the remaining camp will be pushing is the scenario where Scotland votes to leave the UK, but does not get accepted into the EU – the worst case scenario in many minds.
Financial markets seem fairly unperturbed by the news, with GBP/USD actually gaining 0.5%, while the FTSE 100 is eyeing a break above recent highs and the FTSE 250 has already broken out. Both indices look outright bullish.
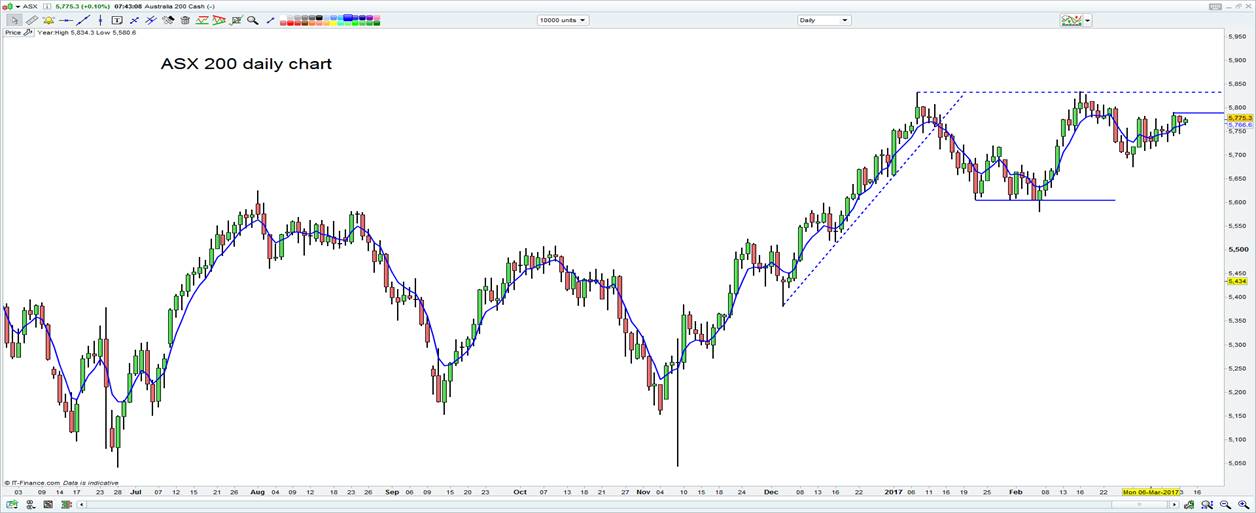
Turning to Asia, we expect small gains on open for the ASX 200 with the opening call sitting at 5775. SPI futures have pushed up 19 points (or 0.3%) in the night session. Technically speaking, a small win will be if we see a push through 5790 (in the ASX 200) and from here I would expect a re-test of the January and March double top at 5830. That level is key for the market and whether we can then feasible start talking about 6000.
The question traders should be asking is would we sell into 5830 or do we stand aside and wait for the close above and look to buy the index on the idea that momentum will take it higher?

The talking point today, though, outside of company specific issues is the strong moves in bulk commodities and this, in turn, is seeing better flows into the AUD, specifically against the EUR. Spot iron ore has closed up 1.8% at $88.26. On the Dalian commodities futures market, we see iron ore up 4.9%, steel +3.9% and coking coal +1.1%.
Positive commentary from the head of the National Bureau of Statistics (NBS) around industrial output (for January and February), electricity generation and freight usage have helped. As has comments from Miao Wei (head of the Ministry of Industry and Information Technology) that the targeted cuts of 50 million tons of excessive steel capacity will not include the sold called ‘illegal mills’. So deeper capacity cuts are seemingly on the way.
BHP’s ADR (American Depository Receipt) is currently up 1.3% but held back a touch by the crude exposure. In U.S. Vale is up 3.9% and that is more indicative of how the likes for FMG may fare. I would be looking to see if we see any buying in energy stocks today, for a view that 12% sell-off in crude since late February is a touch overdone.
