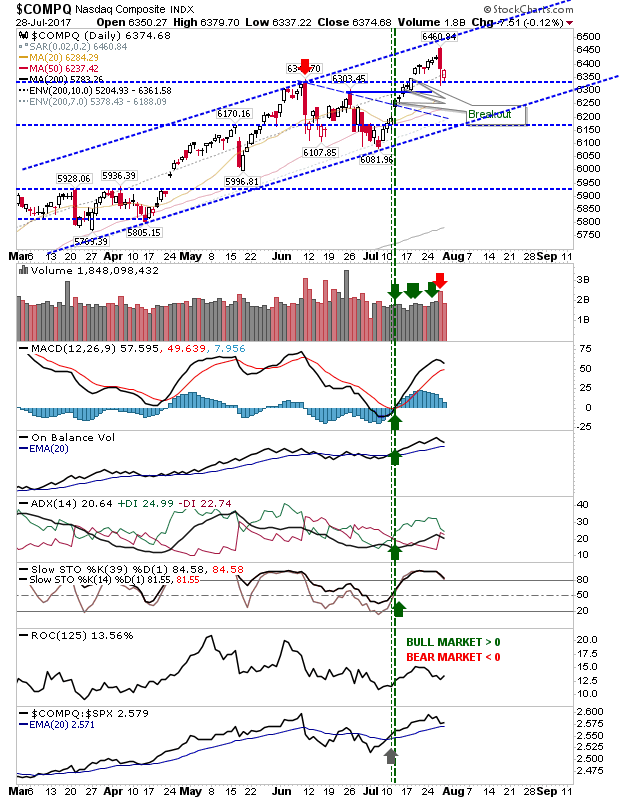
After Thursday's selling there was more downside on Friday which put further pressure on support. The indices best placed to take advantage were the NASDAQ and NASDAQ 100.
The NASDAQ touched 6,350 support for the second day in a row. Selling volume was down on Thursday but as selling didn't violate Thursday's low there is an opportunity for an aggressive long. However, days like Friday aren't typically bullish, but until the market proves otherwise the risk:reward isn't too bad for bulls.
Buyers of the NASDAQ can set stops below 6,335. Technicals are bullish. An opportunity to take a chance?
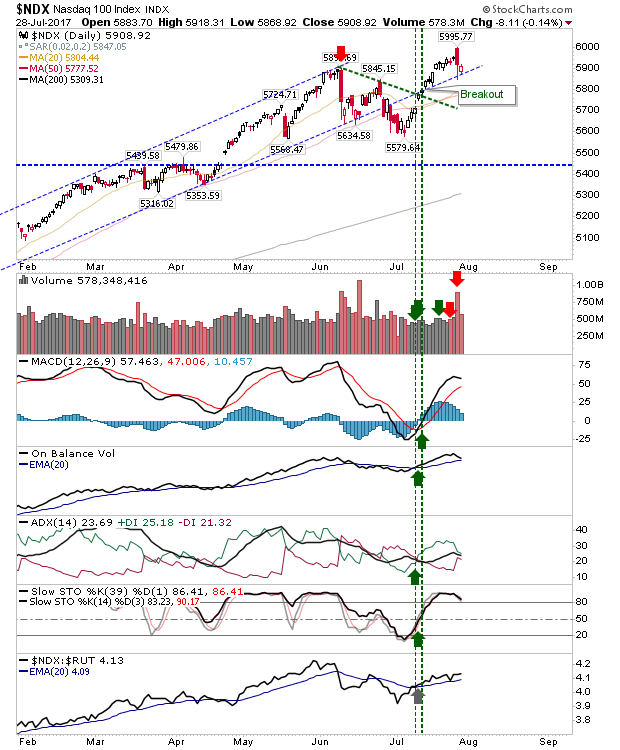
The NASDAQ 100 is at rising support with a stop on a loss of 5,865.
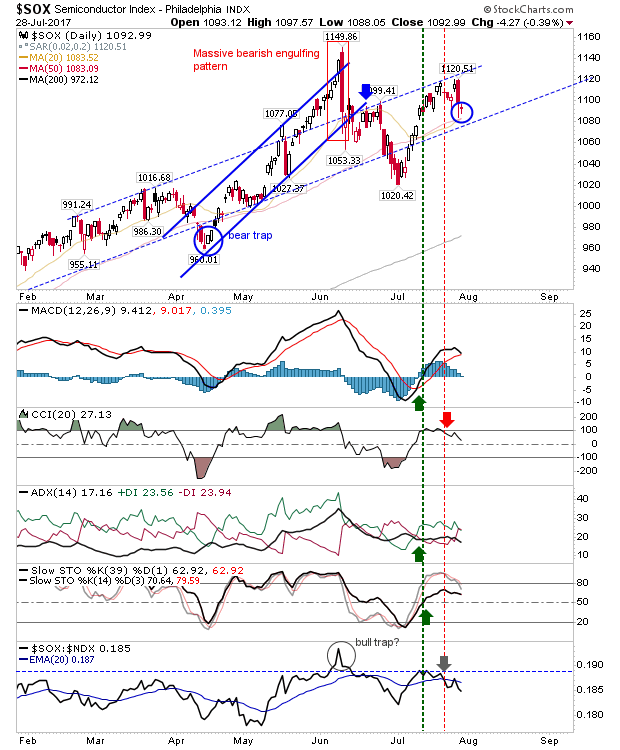
The Semiconductor Index is trading inside the wide bearish engulfing pattern from Thursday. There is a 'sell' trigger in the CCI along with a loss in relative performance against the NASDAQ 100. The convergence of 20-day and 50-day MAs is an opportunity for bulls to counter the trend. Bears now have two bearish engulfing patterns which makes 1,020 a key support level.
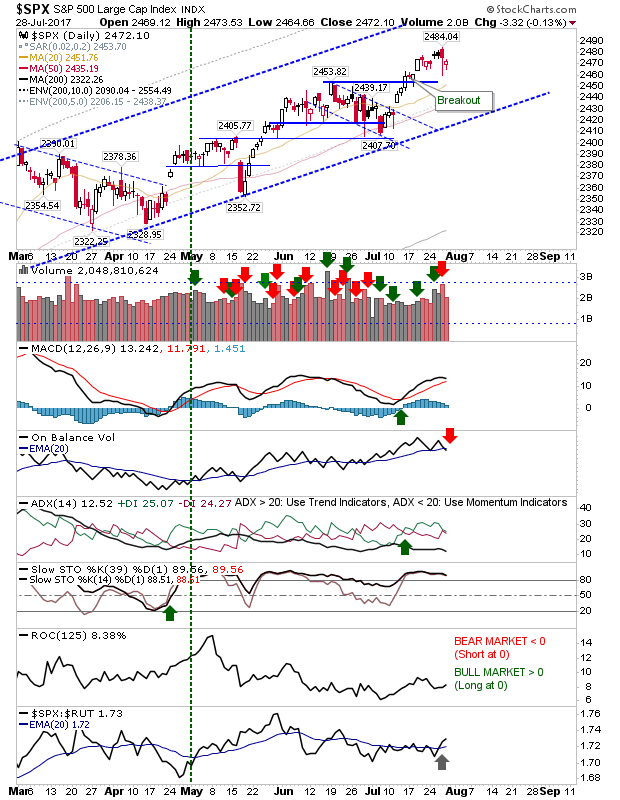
The S&P was relatively resistant to Friday's selling. There was a 'sell' trigger in On-Balance-Volume but it hasn't tested support. On the good news front, there was an improvement in relative performance against Small Caps.
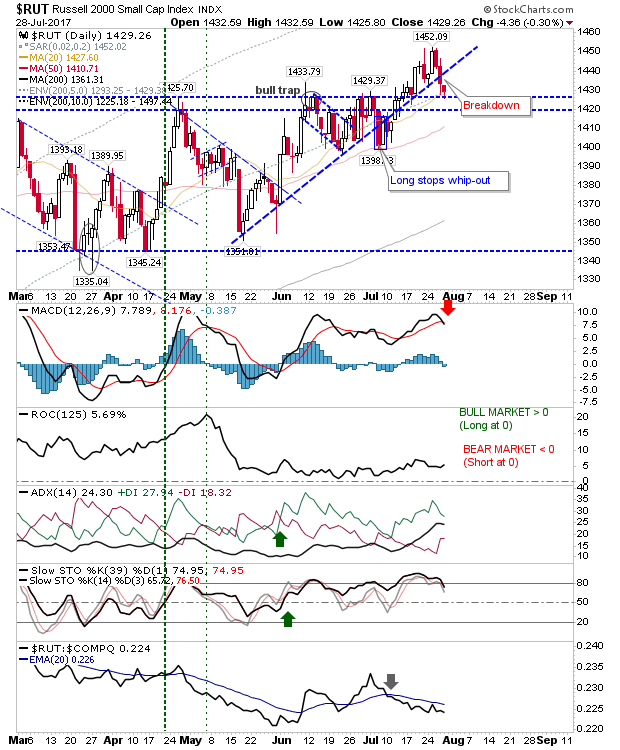
Speaking of Small Caps, the index is caught between a loss of rising support and 1,430 support. There was a 'sell' trigger in the MACD to go with the break. The 20-day MA is also available to play as a source of demand. However, a loss of 1,420 would drop the index back inside the earlier sideways consolidation and open up for yet another test of 1,345. The early part of the coming week will be important.
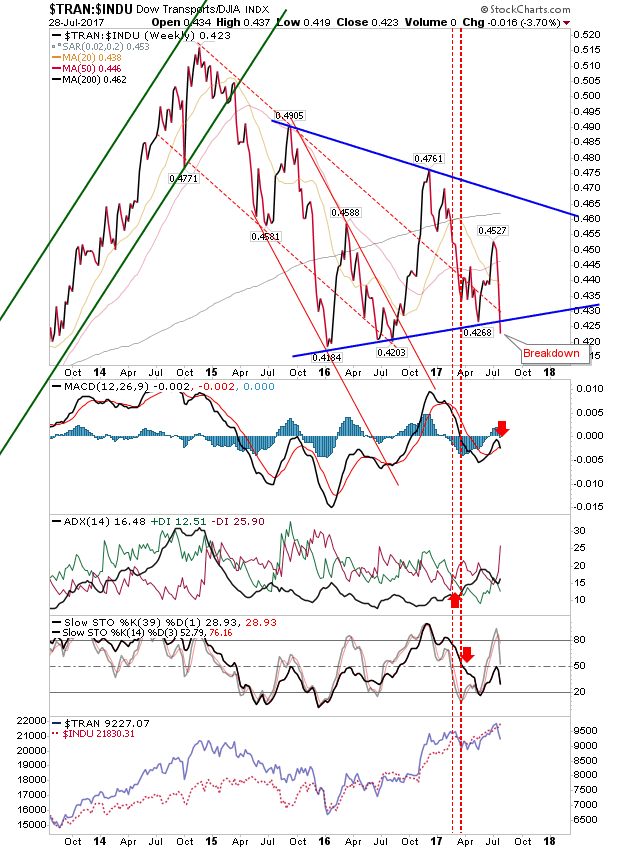
Bearish metrics can be found elsewhere. The relationship between the Transport Index and the Dow Jones has moved to a breakdown after 18 months of consolidating. This is a worrying development as it suggests the economy is about to take a step down - which will eventually filter through to other indices.
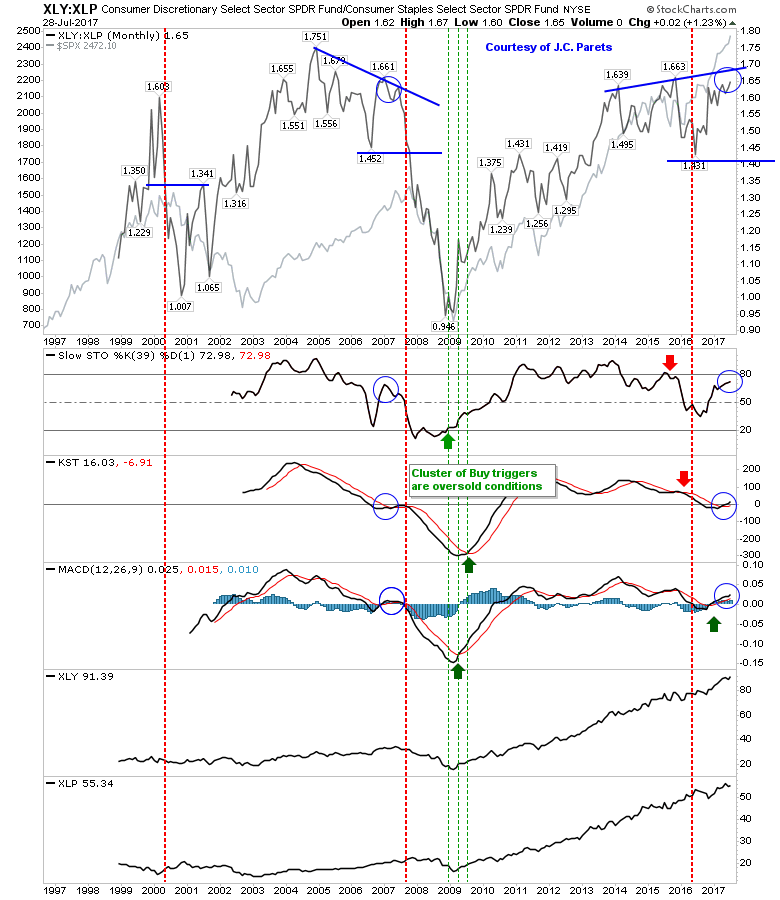
The relationship between Consumer Staples and Discretionary hasn't reached resistance or a potential pivot point but it's a metric I continue to watch.
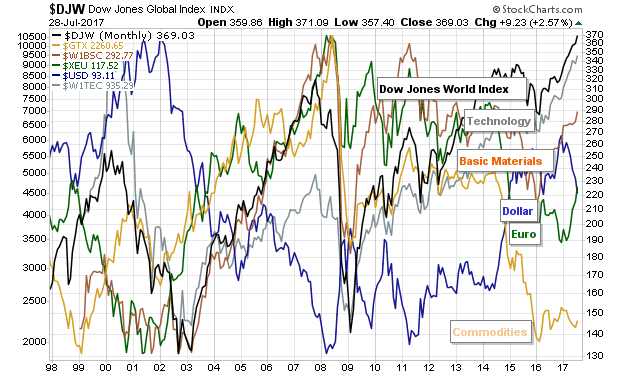
The Big Picture chart shows commodities in discount mode (since the start of 2016) with Technology and world indices overbought.
For today, bulls will want to look for bounces in NASDAQ and NASDAQ 100. Small Caps have a loss in rising support to recover from, but this is not without horizontal support to defend.
