Swing Low For Russell 2000?

Published 03/05/2018, 12:20 AM
Updated 07/09/2023, 06:31 AM
NDX
-
US500
-
DJI
-
US2000
-
IXIC
-
SOX
-

It was a strong finish for markets on Friday as they clawed back some of the early week losses. Some indices do look better than others and could offer bulls the opportunity they need into this coming week.

The best of these could be the Russell 2000. The index left a picture perfect 'tweezer bottom' which has the potential to morph into a swing low. If true then the index should push beyond 1,564 with little difficulty before challenging 1,615; risk is measured against a loss of 1,495.
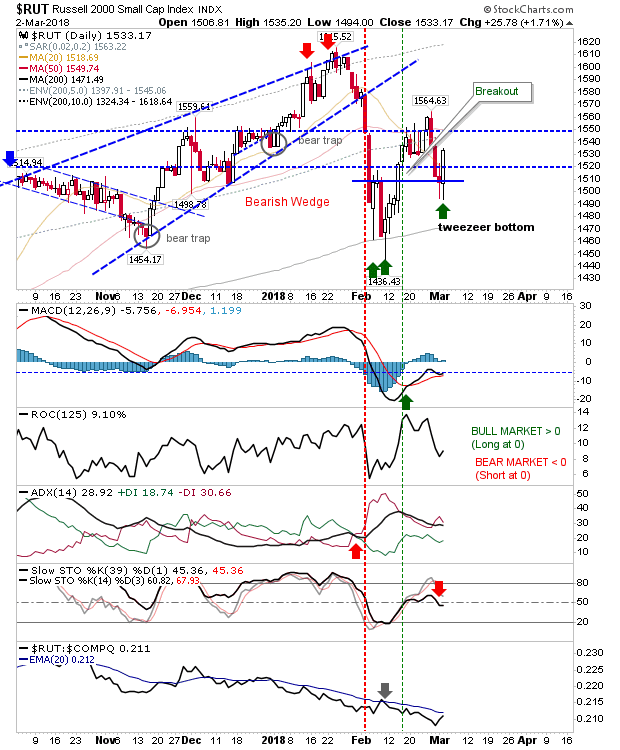
RUT Daily Chart


The Semiconductor Index is another index setting up for a bullish move. The index is close to negating the 1,393 'bull trap' and become the first index to reach 'all-time' highs for 2018; look to this strength to filter down to the NASDAQ and NASDAQ 100.
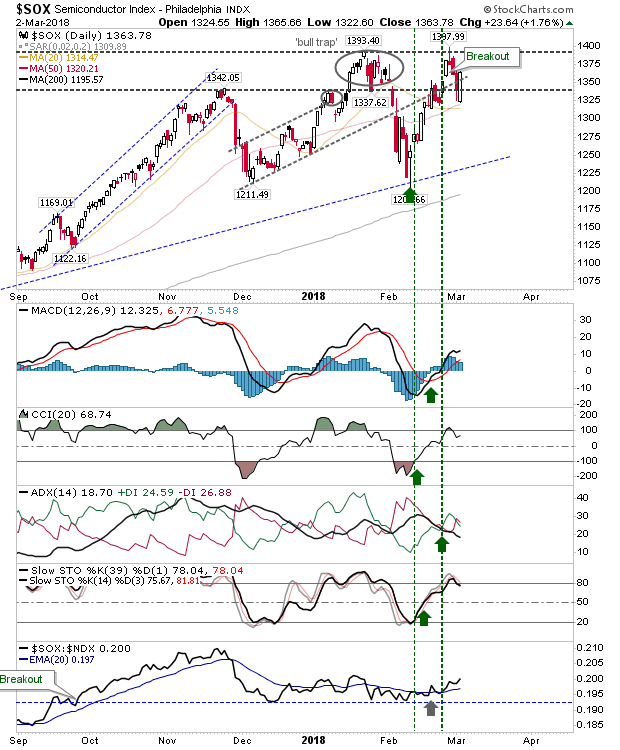
SOX Daily Chart


The NASDAQ 100 has already successfully defended breakout support from February (which coincidentally was also former channel support for the last 6 months). Given the proximity to major resistance, it may take a little longer to actually break to new all-time highs but a loss of 6,645 should be a good place for stops.
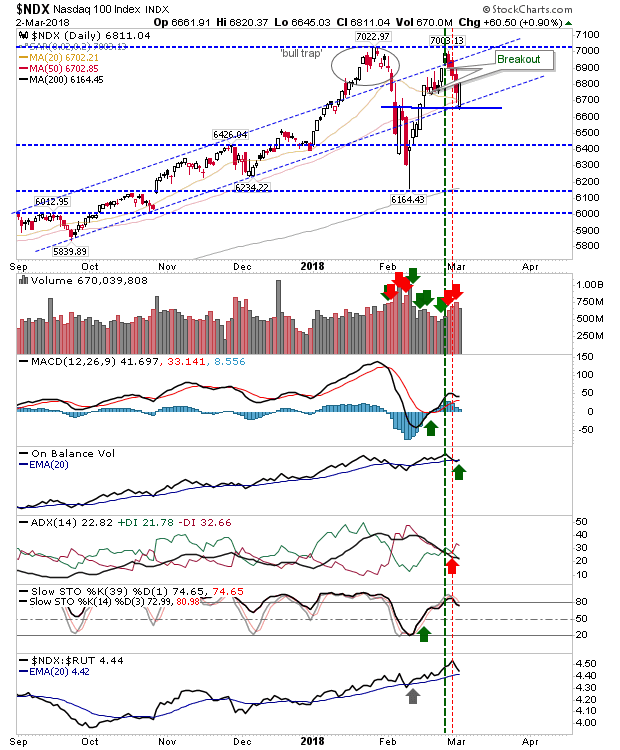
NDX Daily Chart


The NASDAQ is not as bullish as the NASDAQ 100 but measuring upside risk from a loss of 7,085 should be good for the coming week (i.e. buy into weakness towards 7,085). Relative performance continues to do well as it posted new 6-month highs against Large Caps.
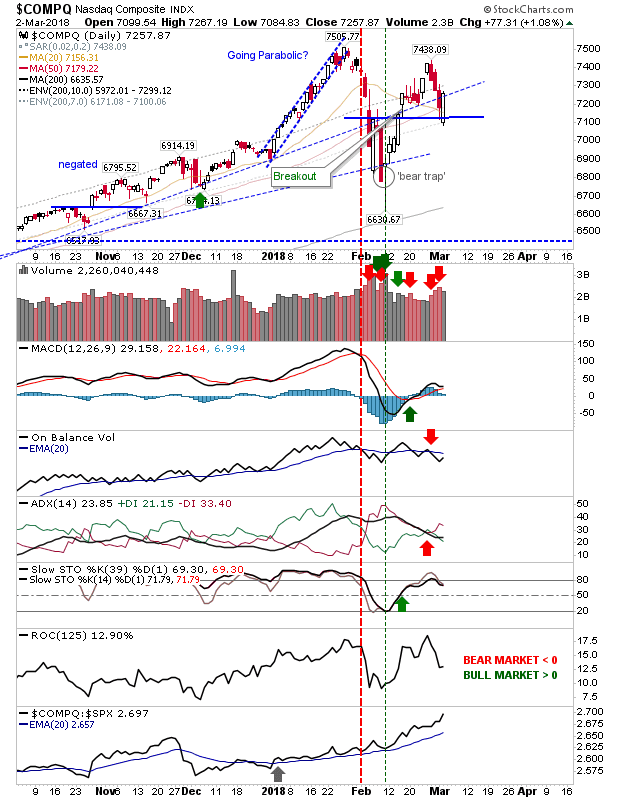
COMPQ Daily Chart


And the only disappointments were from Large Caps. The Dow Jones barely finished higher and finished the week in breakdown territory.
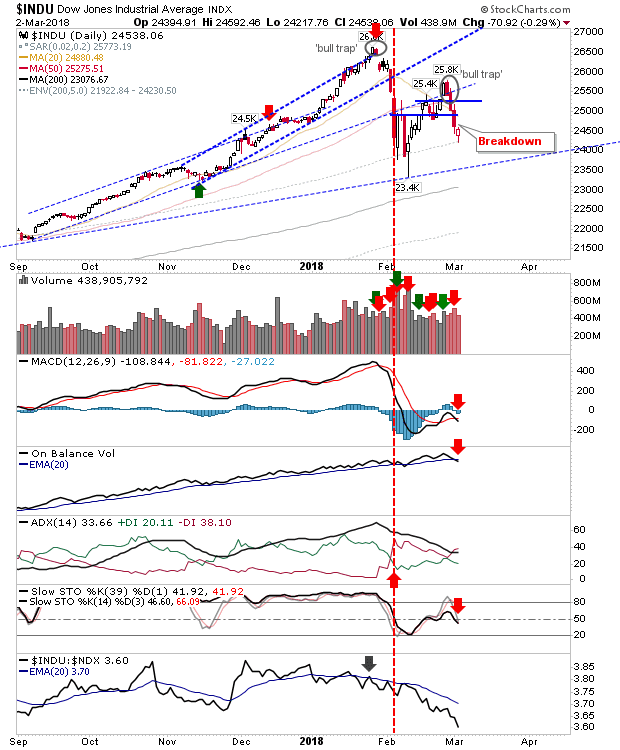
INDU Daily Chart


While the S&P struggled to make it back to the 'bull trap' resistance/support level. It probably did enough to suggest it can challenge the 'bull trap' but it will struggle to negate it. Note the rapid shift in relative performance—this is not an index ready for a leadership role. Luckily, as long as the Russell 2000 can lead it will only be a matter of time before money cycles back into Large Cap stocks.
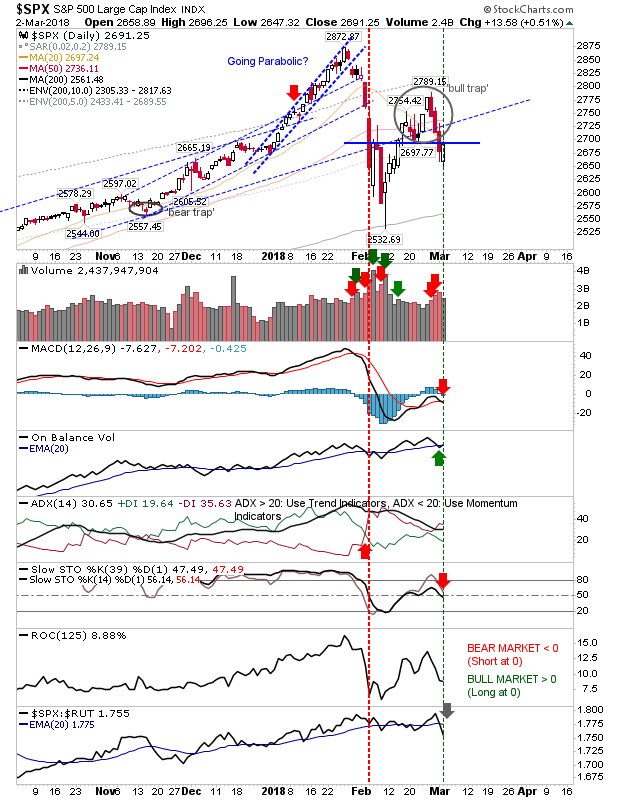
SPX Daily Chart

For Monday, look for Semiconductors and Russell 2000 to lead. Should these struggle to follow through in early morning trading then search for potential shorting opportunities in the S&P and Dow Jones Industrial Average.

Latest comments

Loading next article…
Risk Disclosure: Trading in financial instruments and/or cryptocurrencies involves high risks including the risk of losing some, or all, of your investment amount, and may not be suitable for all investors. Prices of cryptocurrencies are extremely volatile and may be affected by external factors such as financial, regulatory or political events. Trading on margin increases the financial risks.
Before deciding to trade in financial instrument or cryptocurrencies you should be fully informed of the risks and costs associated with trading the financial markets, carefully consider your investment objectives, level of experience, and risk appetite, and seek professional advice where needed.
Fusion Media would like to remind you that the data contained in this website is not necessarily real-time nor accurate. The data and prices on the website are not necessarily provided by any market or exchange, but may be provided by market makers, and so prices may not be accurate and may differ from the actual price at any given market, meaning prices are indicative and not appropriate for trading purposes. Fusion Media and any provider of the data contained in this website will not accept liability for any loss or damage as a result of your trading, or your reliance on the information contained within this website.
It is prohibited to use, store, reproduce, display, modify, transmit or distribute the data contained in this website without the explicit prior written permission of Fusion Media and/or the data provider. All intellectual property rights are reserved by the providers and/or the exchange providing the data contained in this website.
Fusion Media may be compensated by the advertisers that appear on the website, based on your interaction with the advertisements or advertisers.
© 2007-2025 - Fusion Media Limited. All Rights Reserved.