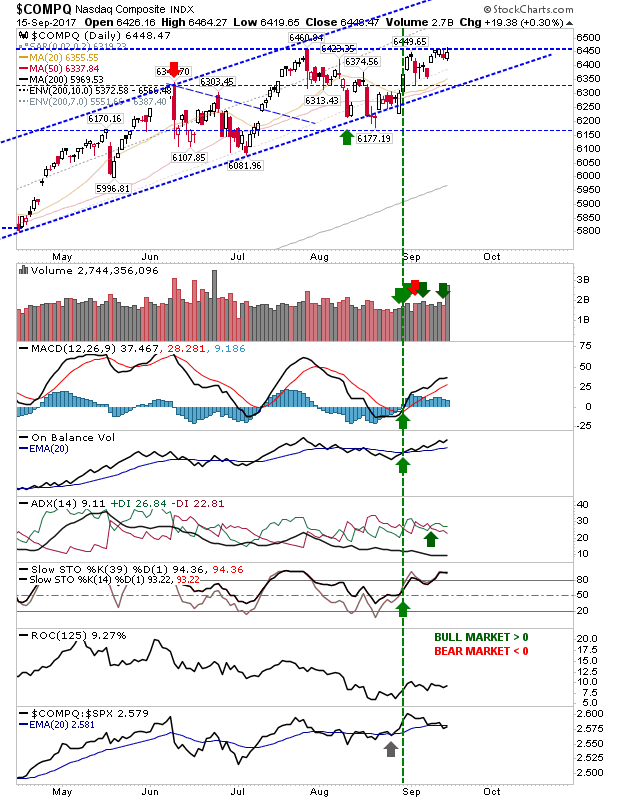
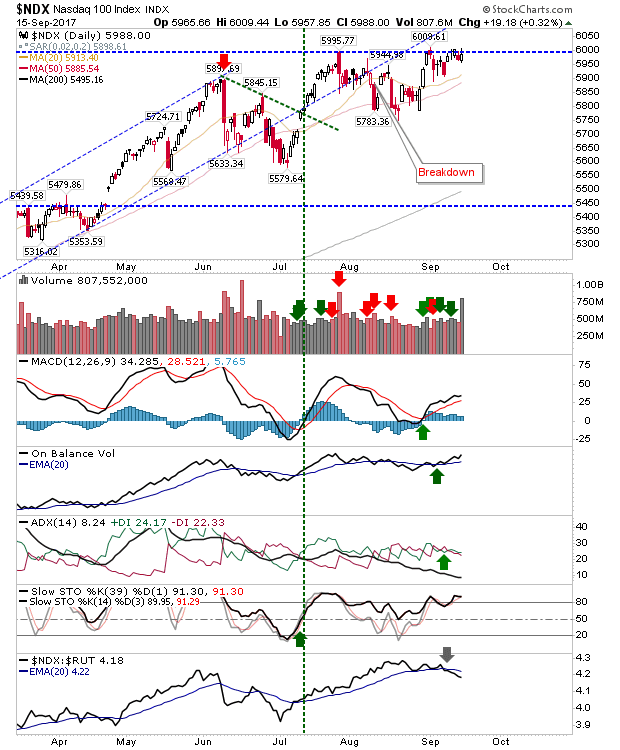
Expiration Friday pushed some heavy volume through the markets but the buying wasn't enough to bring about much-anticipated breakouts for the NASDAQ and NASDAQ 100. However, Friday's action suggests all remains good for this to happen early next week. But any drop below 5,900 in the NASDAQ 100, and 6,350 in the NASDAQ has the potential to set up a cascade of (long) stop hits.
For the NASDAQ, anyone who took advantage of the channel support hit mid-August (green arrow) will be sitting pretty. I would be looking for a move back to channel resistance.
The NASDAQ 100 is provided below for comparison.
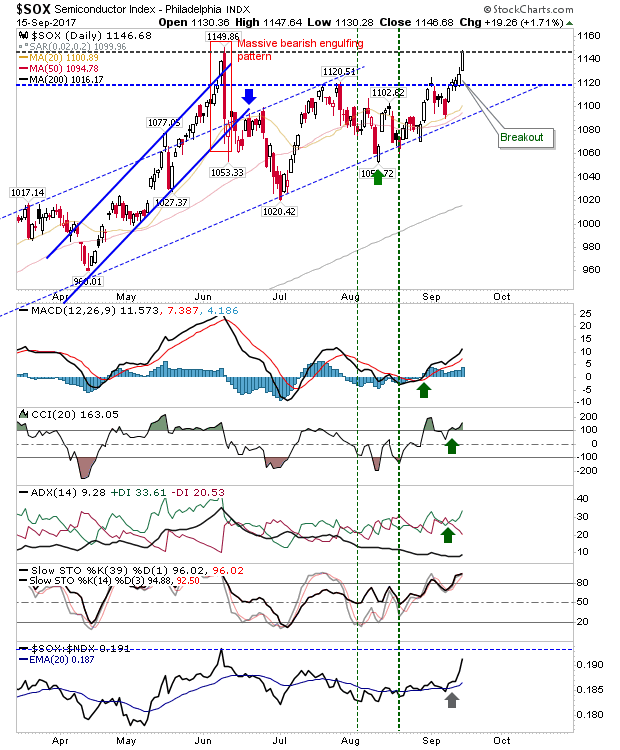
Helping the NASDAQ was a very strong week last week for the Semiconductor Index. Note the uptick in relative strength combined with a challenge of the highs created by June's massing bearish engulfing pattern. Friday's action consumed this overhang supply, and new highs for Semiconductors (and Tech indices) look to be on the cards.
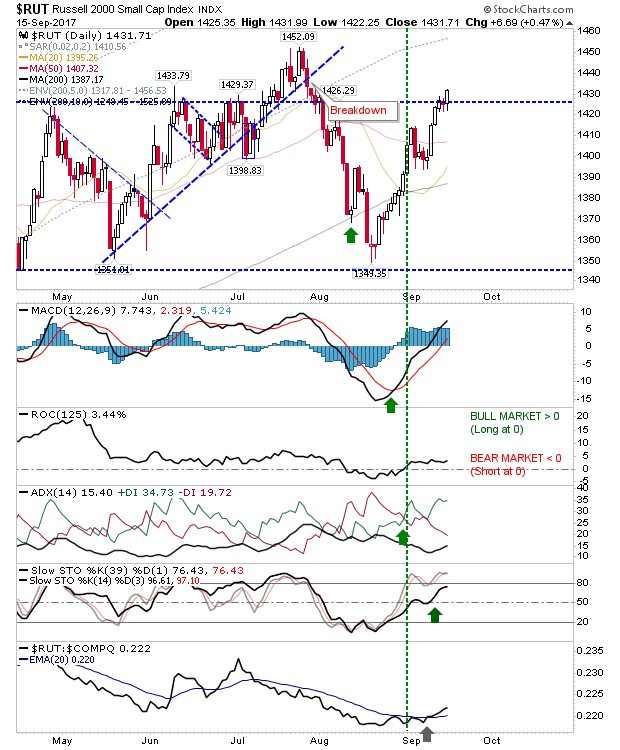
Of other indices, the Russell 2000 made a subtle move to challenge the false breakout in July by closing above 1,430. If you're a short term trader looking for a below-the-radar long opportunity, a move in the Russell 2000 to 1,450 could deliver. The index is enjoying good relative performance which will also help (vs NASDAQ and NASDAQ 100).
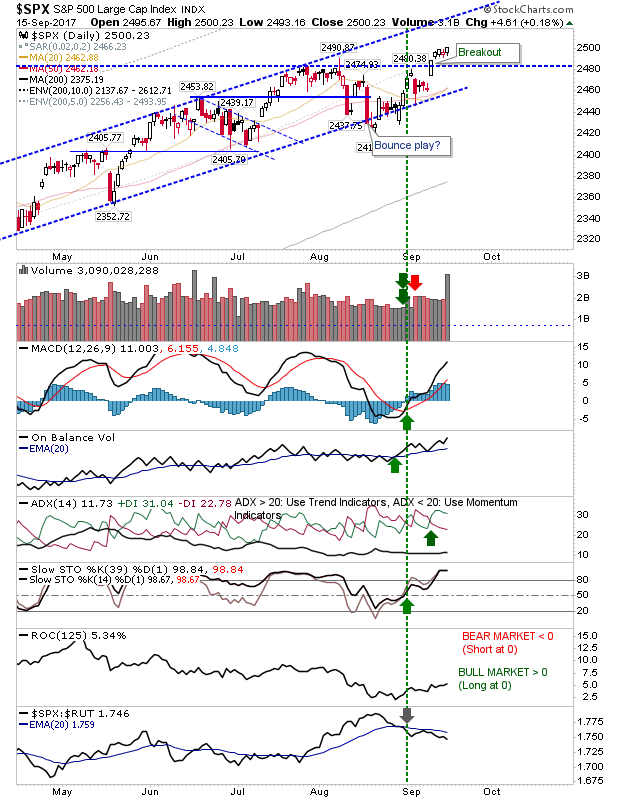
Large Capscontinued to consolidate their breakouts, although I would have liked to have seen them put some distance from breakout support which remains perilously close.
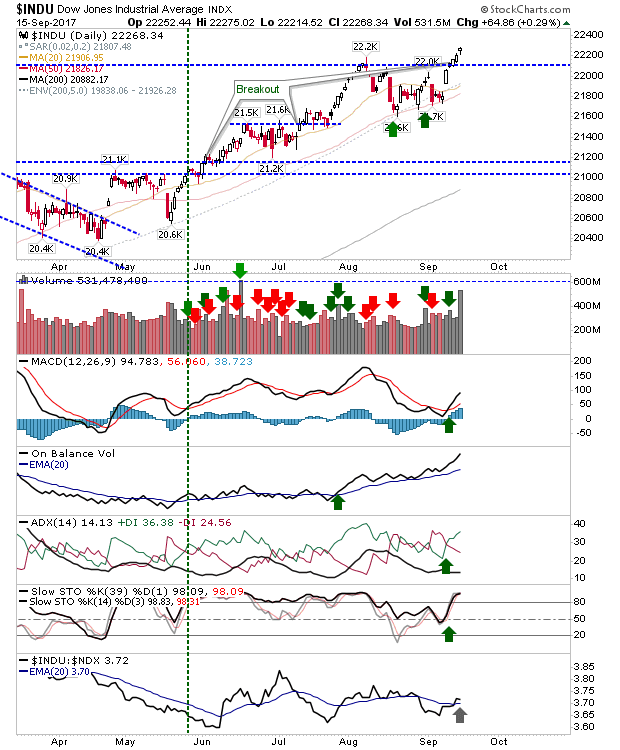
Below is the Dow
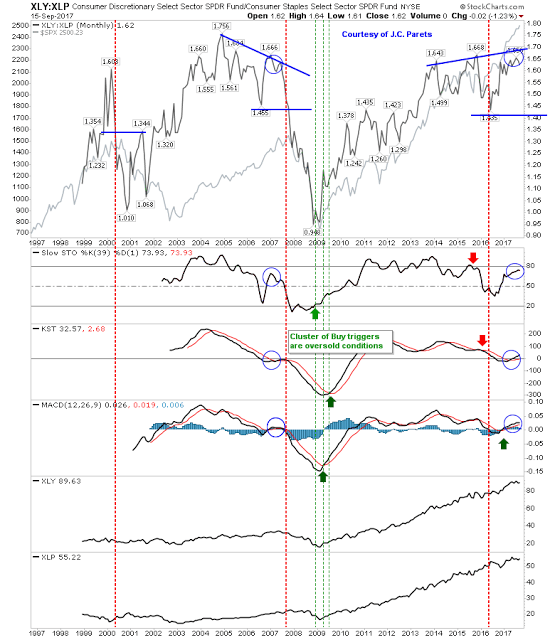
Charts of a longer time frame do not yet suggest a top is in place. For the Staples:Discretionary relationship I would like to see a tag of broadening resistance; note, this is a monthly chart so it could be 2018 before we see this rally peak out.
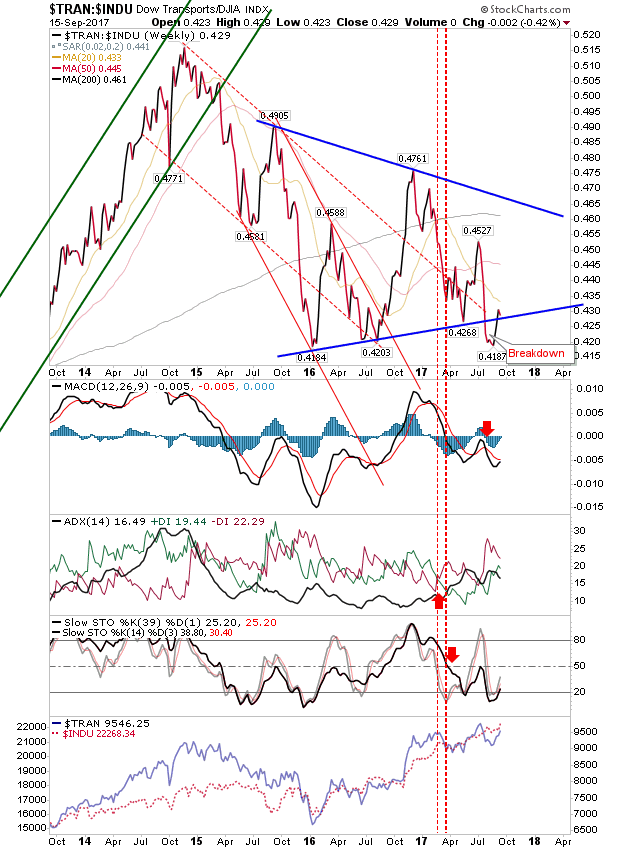
The relationship between Transports and the Dow Jones has the potential to create a 'bear trap' and deliver a big rally for Transports, but if this relationship can't recover inside the 2015-17 consolidation after July's loss, then panic selling could emerge. Supporting technicals suggest weakness and holding support of 9,000 (for Transports) is critical here.
On the larger relative relationship map - commodities remain 'cheap' and indices 'expensive'.
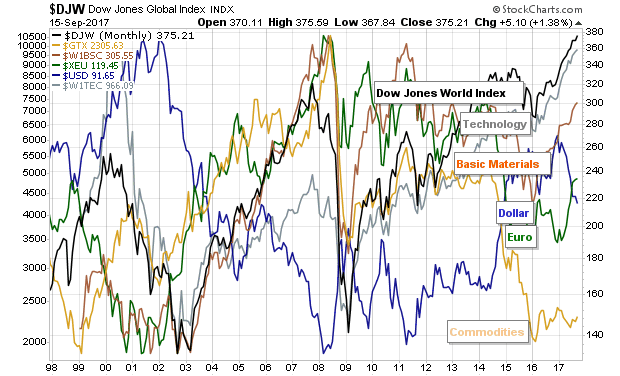
For today, bulls should have an edge with potential breakouts in the NASDAQ, NASDAQ 100 and even the Semiconductor Index. Momentum long players can probably look to the Russell 2000 for a low key opportunity. Shorts will be hoping for long-stop triggers in the NASDAQ and NASDAQ 100 which will give entry opportunities on any bounce back to current resistance.
