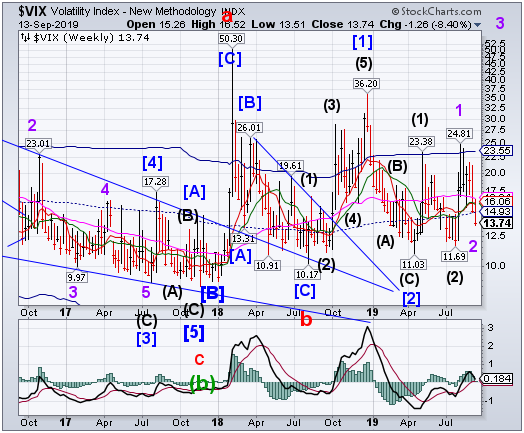
VIX declined beneath the weekly mid-Cycle support at 14.93 after negating its buy signal beneath Short-term support at 16.06.This week it experienced a delayed Master Cycle low.Once it occurs, there is usually at least 3 or more weeks of rally.
(BloombergTV) In this edition of "Options Insight," Bloomberg's Greg Calderone examines the recent volatility and momentum trades in stocks with Bloomberg's Abigail Doolittle on "Bloomberg Markets: The Close."
SPX Rally Continues
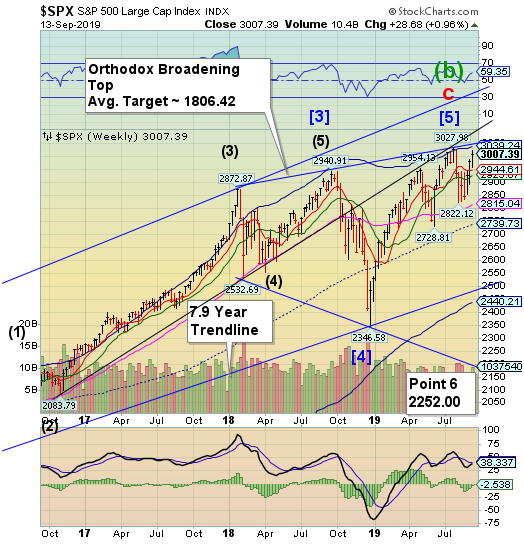
SPX rallied higher, but the hopes for a new all-time high were dashed this week. Market internals revealed a massive rotation underway but not a lot of new money.
(YahooFinance) Wall Street was mixed on Friday, with the S&P 500 and the Dow hovering just below all-time highs as cautious optimism regarding easing U.S.-China trade tensions was held in check by a drop in Apple (NASDAQ:AAPL) stock.
Tariff-vulnerable industrials helped keep the blue chip Dow in positive territory, which was on track for its eighth straight daily advance, its longest winning streak since May 2018.
All three major U.S. stock indexes looked set to post their third straight weekly gains, capping a week that saw signs of a potential thaw in the trade war between the world's two largest economies that has gripped markets for months.
Apple was the biggest drag on the major stock averages, dropping 1.8% after Goldman Sachs cut its price target for the iPhone maker's shares.
NDX Rally Weakens
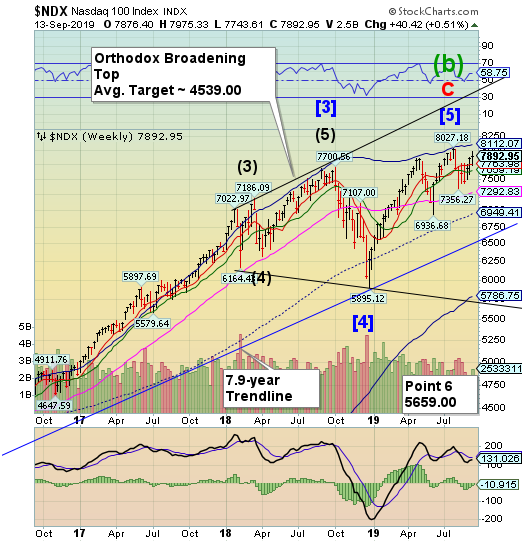
NDX rallied this week, but was unable to hang on to its gains as momentum stocks underperformed due to a massive rotation to value stocks.NDX was scheduled for a Master Cycle high this week and may have met its time requirement on Thursday without making a new high.
(ZeroHedge) In the wake of the sharpest Momentum reversal in a decade, Goldman Sachs addresses some common investor questions on the equity market rotation and discuss what we expect going forward.
Q1: What Just Happened?
In the last two weeks, high momentum stocks have sharply underperformed what had been the equity market’s biggest laggards.
Our Momentum factor tracks the equal-weighted performance of the top 20% vs. bottom 20% of S&P 500 stocks ranked on trailing 12-month returns. The factor has declined by 14% since August 27, which marks the worst two-week return for Momentum since 2009 and ranks in the 1st percentile of historical returns since 1980.
High Yield Bond Index Rises Above Its Support/Resistance Cluster
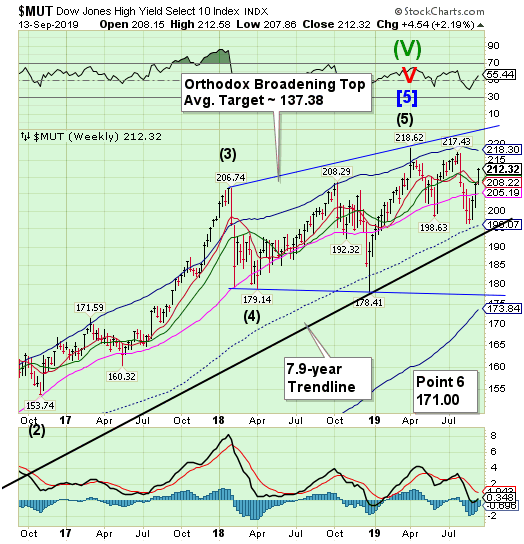
The High Yield Bond Index rallied above its support/resistance cluster at 208.22 but has not made a new high. The sell signal is temporarily suspended until it declines beneath support again. The Cycles Model warns the next step down may be a large one.
(Bloomberg) Warning signs are starting to flash in U.S. credit markets, according to Cantor Fitzgerald LP.
Companies sold around $13 billion of junk bonds this week, the most in more than two years, according to data compiled by Bloomberg. Risk premiums for the securities have dropped more than 1.5 percentage points this year on average, and investors aren’t getting paid much more to buy junk bonds instead of investment-grade, by some measures.
Relatively risky junk-bond sales like a $300 million offering from Core & Main LP, a sewer and water supply distributor, show that the credit markets keep inflating, Cantor Global Chief Market Strategist Peter Cecchini wrote in a note Sept. 12. Companies are taking on more debt, he said.
Treasuries Decline Nearly 3%
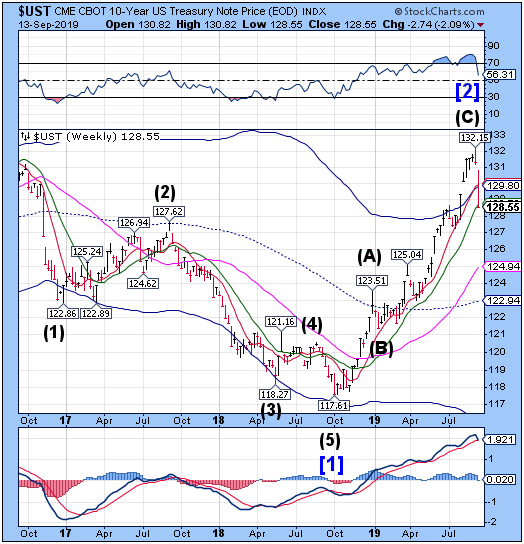
The 10-year Treasury Note Index declined beneath three support levels, putting it on a sell signal. An investor buying at the peak would have already lost two years’ income against the net asset value in the last 10 days. Thus far the turmoil in the other markets is “under the surface” due to a rotation from momentum to value stocks. There appears to be another week or more in this sell-off, according to the Cycles Model.
(ZeroHedge) One month ago we explained why, regardless of the outcome of the US-China trade war and the fate of the US economy, the Fed may have no choice but to resume QE in the coming weeks - potentially as early as 4Q - in order ease funding pressures expected during the coming wave of accelerated Treasury supply as the US Treasury seeks to rebuild its cash balance up to $350 by mid-November.
And while the Treasury has taken its time in rebuilding the cash over the past month, with the latest Treasury cash balance just $184BN as of Sept 11, it only means the ramp up in the coming weeks will be that much more acute. So acute in fact, that as BofA rates strategist Mark Cabana writes today, "the USD funding storm has been brewing for months and is likely to make landfall in Q4."
The Euro Bounces Again At The Neckline
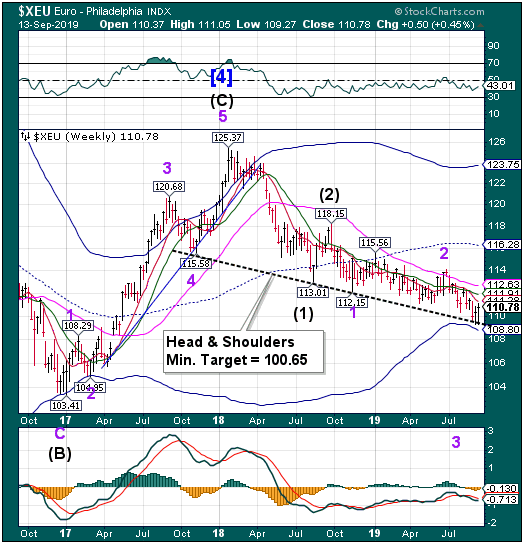
The euro found support again at the Head & Shoulders neckline at 109.30this week.It remains on a sell signalthat may get further confirmation as it crosses beneath the neckline. The Cycles Model suggests a period of weakness stretching through the end of October.
(CNBC) The euro rocketed to a 17-day high against the dollar on Friday as German government bond yields surged on the back of investors thinking the European Central Bank was done stimulating the ailing euro zone economy after cutting rates on Thursday.
The central bank cut its deposit interest rate by 10 basis points to a record low of minus 0.5% and said it would restart bond purchases at a rate of 20 billion euros a month from Nov. 1 for an indefinite time.
The revived bond purchases exceeded many expectations because they are set to run until “shortly before” the ECB raises interest rates. Given that markets do not expect rates to rise for nearly a decade, such a formulation suggests that purchases could go on for years, possibly through most of Christine Lagarde’s term leading the bank.
EuroStoxx Rally Rises Above Resistance
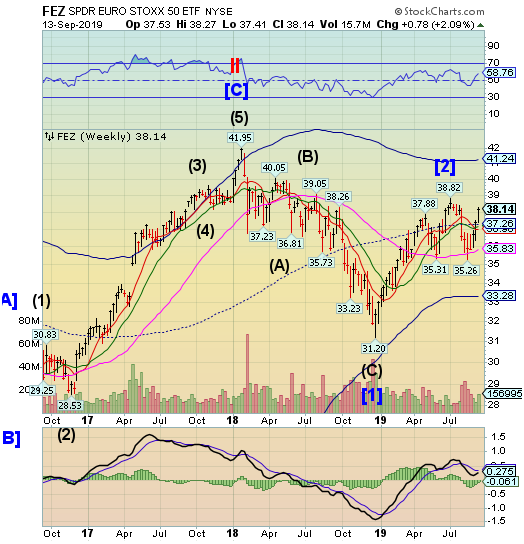
Note: StockCharts.com is not displaying the Euro Stoxx 50 Index at this time.
The EuroStoxx50 SPDR rallied above mid-Cycle resistance at 37.26 in its final burst of liquidity as Draghi retires. The Cycles Model suggests a probable decline through the end of October.
(CNBC) European stocks edged higher on Friday afternoon after the European Central Bank (ECB) delivered an aggressive stimulus package in a bid to reinvigorate the ailing euro zone economy
- The pan-European Stoxx 600 closed 0.4% higher, banks and basic resources emerging as the best performing sectors with roughly 2.8% in gains while food and beverage stocks dropped 1.9%.
The ECB announced a new quantitative easing program Thursday which will see 20 billion euros ($21.9 billion) per month of net asset purchases for as long as the central bank deems necessary. It also cut the rate on its main deposit facility by 10 basis points to -0.5%, a new record low, and introduced tiering measures to mitigate damage to banks’ balance sheets.
The Yen Declines Beneath Intermediate-Term Support
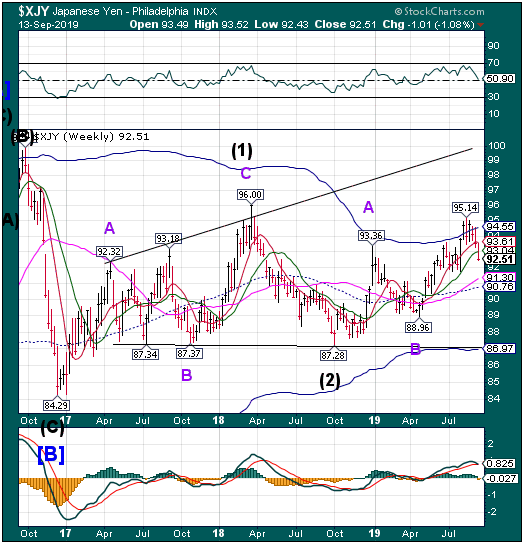
The yen declined beneath Intermediate-term support at 93.04 as a Master Cycle low may have been made on Thursday. It has been a longer than usual shakeout but may now support a resumption of the rally through mid-October.
(ForexLive) The Japanese Yen is a safe haven currency which investors rotate into during times of uncertainty. The Yen is most probably the largest risk sentiment mover and is the go to currency of choice for risk on and risk off moves.
So, the next time there is a big shift in risk sentiment, remember that you are likely to see strong movements in the JPY.
Falling equity markets=Risk off= YEN strength
Rising equity markets=Risk on= YEN weakness
Look at the reaction to the latest Trump news on an interim China deal to delay tariffs to see how the JPY reacts to positive risk sentiment. It serves as a useful lesson
Nikkei Rises Above Mid-Cycle Resistance
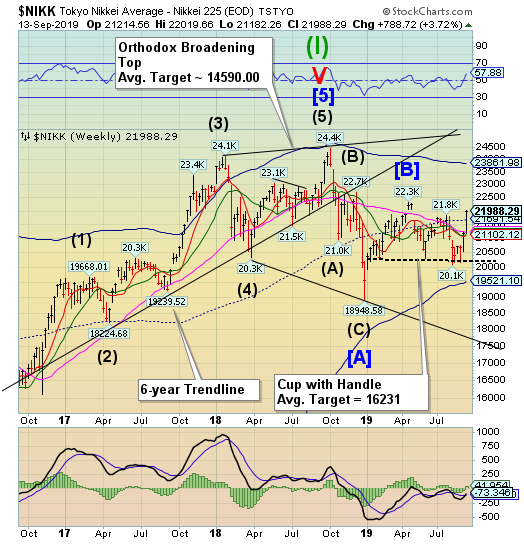
The Nikkei Index continued its rally for a third week off the Lip of the Cup with Handle formation at 20150.00. It appears to have completed its inverted Master Cycle due this week. Should a reversal occur, the decline may last through the end of October.
(JapanTimes) The benchmark Nikkei average topped 22,000 in Tokyo trading on Friday, with buying sentiment reinvigorated by stepped-up easing from the European Central Bank and rosier prospects for a U.S.-China trade deal.
The 225-issue Nikkei average rose 228.68 points, or 1.05 percent, to end at 21,988.29 on the Tokyo Stock Exchange, advancing for the ninth straight market day, the longest winning streak since a 16-session rise in October 2017. On Thursday, the key market gauge gained 161.85 points.
The Topix index of all issues listed on the TSE’s first section jumped 14.77 points, or 0.93 percent, to 1,609.87, after adding 11.44 points the previous day.
U.S. Dollar Reverses Down To Short-Term Support
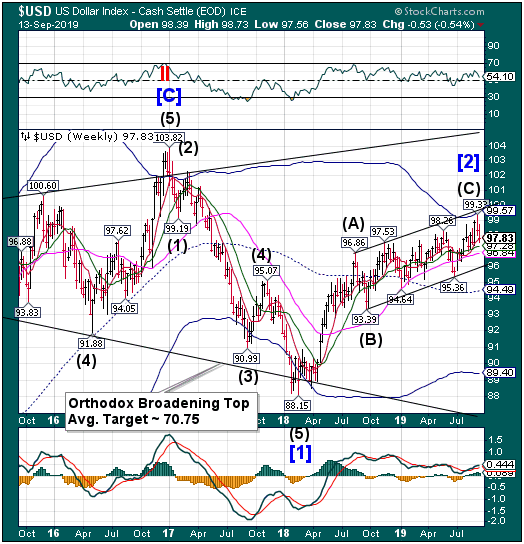
USD declined quite unexpectedly this week to close just above Short-term support at 97.81. Should the decline continue next week, we may see the USD challenge its trendline at 96.00. USD may reach its low by the end of the month.
(ZeroHedge) The fiscal year that started on Oct 1, 2018, is now in its final month, and yet according to the US Treasury, in the first 11 months of the fiscal year, the US Treasury has already accumulated a more than $1 trillion budget deficit.
According to the latest budget data, In August, receipts rose 4% y/y to $228.0b in Aug, which however were dwarfed by $428.3 billion in outlays (a 1.1% drop Y/Y). The result was that the August monthly deficit was $200.3 billion, in line with expectations, if fractionally smaller than the $214.1 billion deficit posted in August 2018.
The biggest source of income, at $106 billion was income tax, with social insurance second at $96 billion. On the outlays side, the government spent the most money on entitlements such as Social Security ($88BN) and Medicare ($85BN). It may come as a surprise to some that National Defense was only third at $64BN.
Gold Slips Beneath Round Number Support
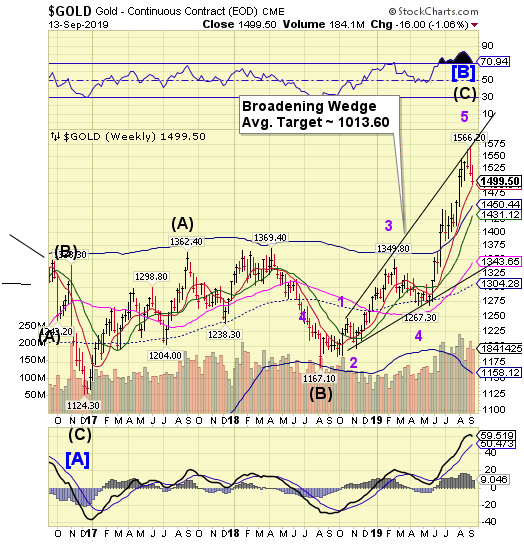
Gold slipped beneath 1500.00 which is an important support level. Beneath this lies a sell signal that is confirmed below Short-term support at 1490.84. This may set a more serious decline in motion that may have bigger implications.
(KitcoNews) - Next week, market participants will be keeping a close eye on $1,500 as the first line of defense gold prices have to hold in the near term, according to some analysts.
The gold market is preparing for a third week of consecutive losses; although the market is still in a technical uptrend, pessimism is starting to creep into the market as safe-haven demand starts to weaken.
December gold futures last traded at $1,496.50 an ounce, down more than 1% from last week.
Crude Consolidates Beneath Resistance
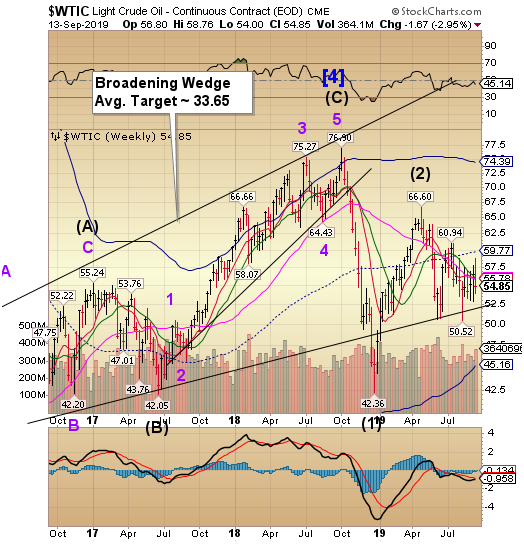
Crude made a high not seen since July but could not hold on to its gains. The Cycles Model suggests the Broadening Wedge formation may be triggered in the next week, should the slippage continue. It remains on a confirmed sell signal.
(OilPrice) OPEC and its partners will not deepen their oil production cut yet but will discuss the topic again in December. This is what Saudi Arabia’s newly appointed Energy Minister Abdulaziz bin Salman told media after this week’s meeting of the Joint Ministerial Monitoring Committee. A discussion, however, may not be enough. OPEC+ may be forced to decide to cut deeper to prevent a major slump in prices.
When OPEC+ agreed to cut 1.2 million bpd from the global market in December last year, benchmark prices reacted without much enthusiasm. In hindsight, this was a harbinger of tough times. Although prices rallied in the beginning of the second quarter of the year with Brent topping $70 a barrel, the rally was brief and correction followed soon enough.
Agriculture Prices Reverse From The Cycle Bottom
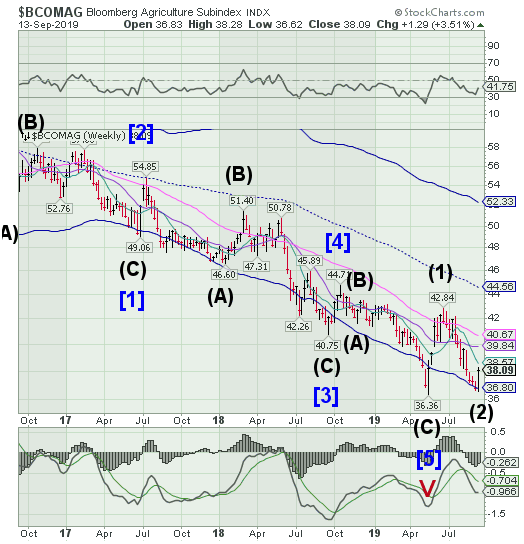
The Bloomberg Agricultural Sub index appears to have hit its Master Cycle low at 36.62 on Monday. It has been rising since then. A rally above Intermediate-term resistance at 38.57 offers a potential buy signal.
(Bloomberg) There’s been plenty of back and forth in the U.S.-China trade war. But for the first time in months, crop markets have started to show some optimism that the two sides can reach a deal, giving American farmers some hope.
China is encouraging companies to buy U.S. farm products, which it will exclude from added tariffs. That’s the latest in series of baby steps Bejing and Washington have taken in the last week to ease trade tensions. In the past, agriculture prices have had muted reactions to similar developments, with rallies on deal progress quickly fading.
This time, though, the gains stuck -- at least, for a week.
Shanghai Index Challenges Mid-Cycle Resistance
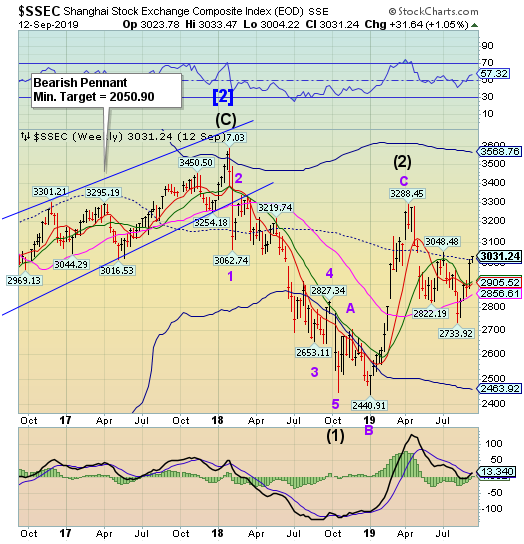
The Shanghai Index challenged mid-Cycle resistance for a second time since June.The Cycles Model suggests that Cyclical strength may run out early next week, making this rally a probable red herring for investors.
(Bloomberg) China’s lifting of barriers for foreign investment in its stock and bond markets is a surprise gift for investors in the run up to the 70th birthday party of the People’s Republic.
While the move is seen by analysts as long on symbolism and short on impact, it’s likely to help sustain the rebound in domestic equities ahead of the crucial anniversary as well as stabilize the currency, which is trading near a decade-low. The announcement also follows Friday’s decision by the central bank to inject liquidity by lowering banks’ reserve ratios.
The Shanghai stock benchmark has climbed 9% in the past month, the best performer among global gauges. Rising turnover and increasing margin debt suggests investors are starting to flock back to equities after the trade war sparked a slump earlier in the year. Overseas investors pumped a net 28 billion yuan ($3.9 billion) into the nation’s shares via exchange links last week, the most since November.
The Banking Index Bounces At Cycle Bottom Support
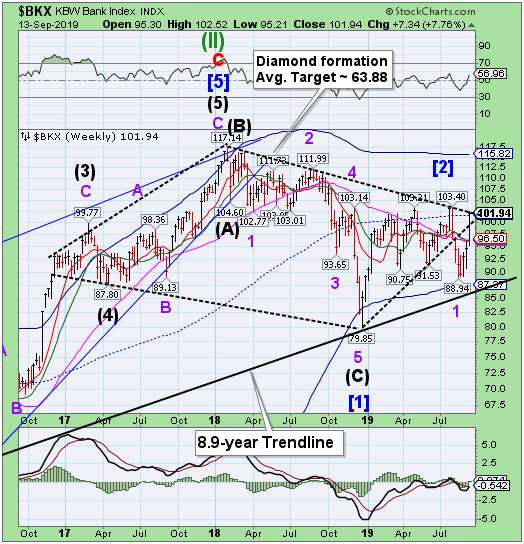
--BKX rose to challenge mid-Cycle resistance at 101.59, but was stopped by the upper trendline of the Diamond formation just above it.It appears that a final burst of strength in the Liquidity Cycle may end this weekend.The Cycles Model suggests a probable decline through the end of October.
(Bloomberg) The declining economic outlook and increasing political pressure are pushing central banks into more aggressive unconventional monetary policies. Simultaneously, fears are growing that such steps, especially negative interest rates, actually threaten the stability of the financial system. They risk setting off dangerous feedback loops in credit markets and the real economy, where the second and third-order effects are difficult to anticipate or control.
As the experience of banks in Japan and Europe has illustrated, the process follows a predictable pattern.
Low growth, low inflation, output gaps, unemployment and underemployment -- combined with financial instability, especially volatile asset prices -- first prompt central banks to lower rates below the zero bound. The objective is to stimulate borrowing to finance consumption and investment, thus setting off a self-sustaining growth cycle.
Typically, however, negative rates aren’t fully reflected in actual borrowing and lending rates. Regulations require banks to maintain customer deposit bases. The fear of losing customers dissuades those banks from cutting deposit rates too far. In Europe, to date, only large corporations have faced negative rates, which means they’re charged to maintain deposits.
(ZeroHedge) When it comes to Mario Draghi's relationship with Germany's notoriously fiscally (and monetarily) conservative public, it tends to be a love-hate affair. Actually, scrap the love part.
Back in March 2016, when the ECB cut rates and expanded its QE (in an operation that just like Thursday left market's underwhelmed, and sent the EUR surging), Germany's press responded not too kindly to Draghi's monetary largesse with Handelsblatt, in an article titled "The dangerous game with the money of the German savers", provided a metaphorical rendering of what is happening in Europe as follows:
The German magazine also painted an oddly accurate caricature of the man behind Europe's monetary lunacy:
