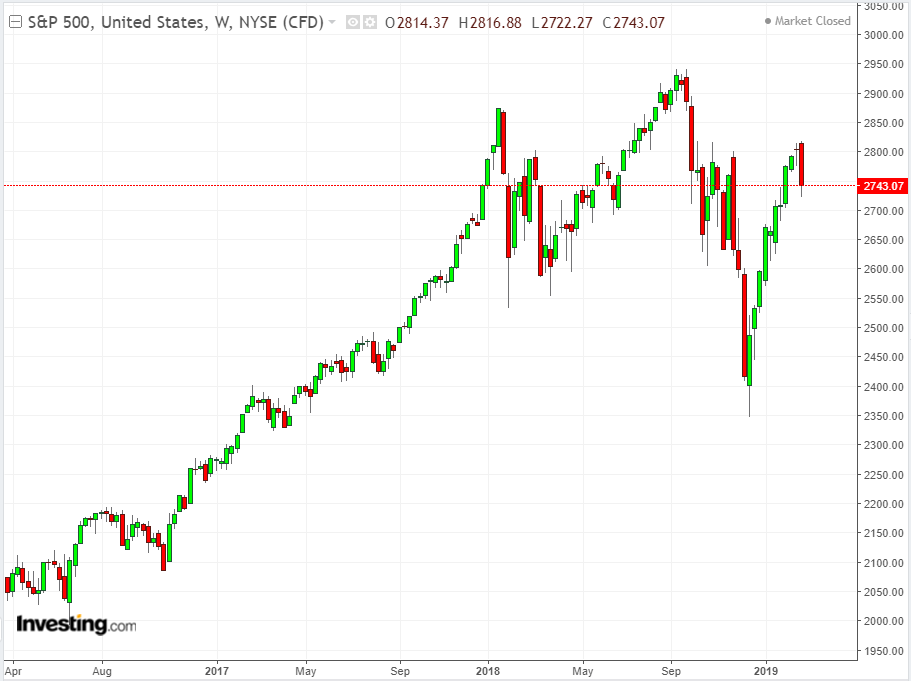
The S&P 500 will start the trading week only 2.03% below the 2800 level. But that's not where many analysts expected the benchmark index to be after it hit that peak early last week.
The expectation last Monday was that by now the SPX would be trading above the psychological level and moving toward new highs. The S&P has hit 2,800 four times between Oct. 17 and Feb. 25, but dropped back each time. A solid move above 2,800 would be a signal for a potentially sizable move higher, possibly even to new records.

Instead, on Friday the index finished a rocky day, -0.21%, sealing its worst weekly performance so far in 2019 after a five-day losing streak left it down 2.15%. The Dow and NASDAQ Composite also declined every day last week, ending the week lower by 2.2% and 2.46%, respectively.
So how likely is it that we'll be seeing that key level breached this week? A five-day losing streak or longer doesn’t occur that often, after all. Rarer still is when all three major averages drop in tandem for five straight days or more.
The last time that happened was over the nine days before the 2016 presidential election. However that was followed by the S&P surging 41% until peaking at 2,941 in September. That rally was triggered by Wall Street's bet that a President Trump meant a huge corporate tax cut.
This time though, given both the political and economic landscape, the situation may well be different.
Last week's selling was mostly due to investor unhappiness fueled by concerns about the lack of details as to what a U.S.- China trade deal might look like, after multiple reports said a deal was imminent. Add to that economic worries after the European Central Bank announced a stimulus package to help struggling economies in the European Union. In the United States, Friday's weak jobs report was an additional negative surprise, along with mixed economic data during the week.
Still, though a real trade deal would have cheered many, the internal forces that recently helped cap the market's gains since the Christmas slump tell a different story. They helped power volatility and will weigh on markets.
Start with the speed of the recovery. Between its Dec. 26 low and its intraday high on Feb. 25, the Dow moved up 21%. The S&P 500 and NASDAQ were up 20% and 23.5%, respectively, when each hit their peaks early last Monday on news a trade deal was on the way.
By comparison, it took the S&P 500 all of 2017 to register a 19% gain.
The speed of the rebound was such that, beginning during the second half of February, technical indicators, specifically the relative strength indices, were starting to signal the big recovery was too much. These indicators influence computerized trading programs, which now dominate stock markets, feeding momentum data to robotically issue sell or buy orders when specified conditions are reached.
Over the past week the sell orders poured in. At the same time, important stocks that contributed significantly to last fall's market rally continue to struggle.
Apple (NASDAQ:AAPL) may be up nearly 10% this year, but it's still 25% off its all-time high of $233.47, reached on Oct. 3, 2018. Amazon (NASDAQ:AMZN) is off some 20% from its all-time high of $2,050.50, reached on Sept. 4. Facebook (NASDAQ:FB) is off 21% from its July 25 peak of $ 218.62. And Google (NASDAQ:GOOGL) parent Alphabet (NASDAQ:GOOG) is off nearly 10% from its $1,273.89 peak made on July 27.
Nevertheless, a few stocks are hitting new highs. However, since last Monday, the Dow has seen no new highs after Merck (NYSE:MRK) and Nike (NYSE:NKE) both slipped lower.
Boeing (NYSE:BA), though up 30% this year and still the Dow's best performer, hit an all-time high of $446.01 on March 1 but has now slumped, pressured after Sunday's crash of an Ethiopian Airliner 737 Max jet. The crash, the second for this model aircraft in about four months, killed 157 on board.
On Wednesday, the only NASDAQ 100 stock to hit a 52-week high was Starbucks (NASDAQ:SBUX). On Thursday, just Dollar Tree (NASDAQ:DLTR) and Xcel Energy (NASDAQ:XEL), the Midwestern and Western electric utility held that honor. On Friday, it was just Dollar Tree and Cadence Design Systems (NASDAQ:CDNS).
Economies aren't teetering as they were in 2008. So the malaise we saw last week shouldn't be viewed as signaling an upcoming market rout. Still, if the S&P does breach 2,800, and new market highs come into sight, it will likely happen in the spring, before summer doldrums set in. Of course, that will depend on geopolitics, especially a trade deal with substance, and global economics.
But the math governing markets also strongly suggests a big, fast rush higher will produce another big rapid pullback.
