The good times are here. Equity markets are breaking above their longer-term moving averages and the smell of fear from active managers of missing any further upside is clearly causing more money to reluctantly flood into the markets. The S&P 500 is a whisper from taking out the May 2015 high and on a total return basis (ie. reinvesting dividends) the index is only 0.2% from its prior high. Credit spreads continue to be narrow, providing the equity rally with real backbone, with investment grade (Baa) spreads the tightest relative to US treasuries since August 2015. High yield also continues to work, with the iShares iBoxx $ High Yield Corporate Bond (NYSE:HYG) breaking above the 200-day moving average for the first time since September 2014.
The VIX (US volatility index) is down for six days in a row and is at multi-month lows. Investors will cheer, while short-term traders will be feeling frustrations, but this is where patience plays a key part in the discipline of trading.
US crude (June contract) started a 10.7% decline on 13 April, but is now back eyeing a break of the 13 April prior high of $43.68 and a break would be undoubtedly positive for risk sentiment. We are seeing modest selling in the barrels today though, likely as a result of the 3.1 million increase in API inventory data, which should be a good lead in for today’s DoE inventory report due at 00:30 AEST (consensus is for a 2.3 million barrel increase). This report is an event risk to have on the radar.
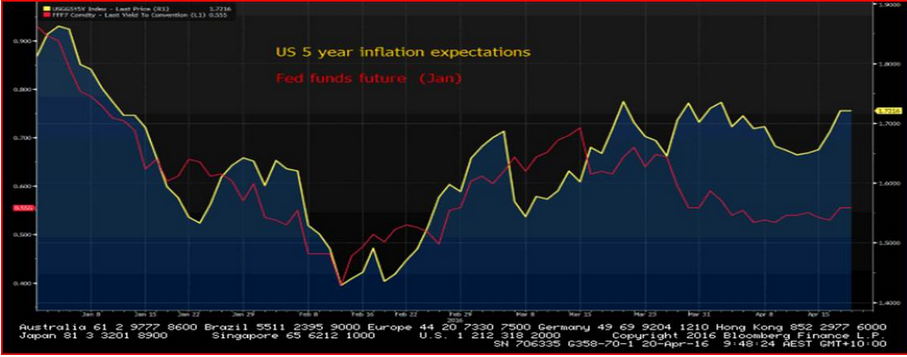
With energy looking supported, US five-year inflation expectations are starting to noticeable move higher and potentially looking to break out of the recent consolidation (see Bloomberg chart below). Importantly, there is a growing disconnect between inflation expectations and the implied probability priced for future moves from the Fed. Here we see a mere 4.5 basis points of tightening for the June FOMC meeting and 11.5bp for September, while the first full rate hike is not priced in until June 2017. This is seen as a positive short-term development, but may prove to be a hugely dangerous game for the US and global economy. Buy gold or silver?

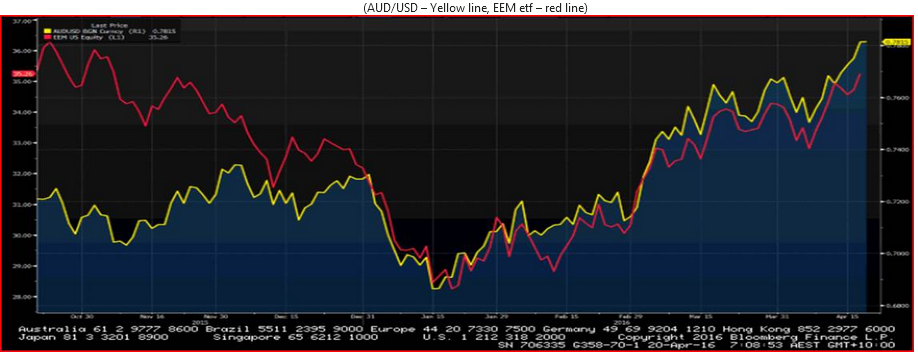
There have been huge inflows into emerging market assets have also been such a stabilising factor in global sentiment and have been assisted by a one-two punch both from a 6% decline in the Fed’s own trade-weighted dollar index since January and China’s stimulus program. Just take a look at the overlap between iShares MSCI Emerging Markets (NYSE:EEM) and AUD/USD (see Bloomberg chart below).

There has to be a tipping point where the moves higher in asset markets result in a breaking point for inflation expectations, but that is for traders to time. As things stand, the US interest rate market is simply not positioned for a further increase in inflation expectations and this will be the point when traders will look to start buying USDs with their ears pinned back. That point isn’t now though, and it feels as though there is still some juice in this trade, especially with US earnings in full flow and some 82% of 58 companies who have beaten on EPS, 58% on sales.
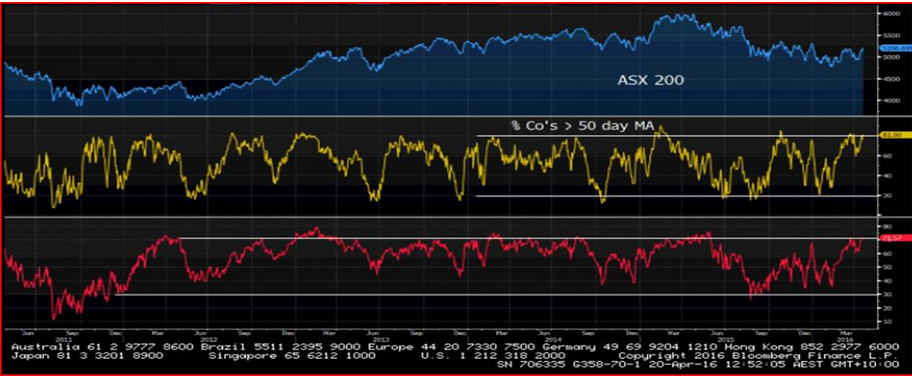
The ASX 200 has seen a strong rally from 8 April in-line with other developed markets, and I still hold a reluctant bullish bias. However, I am happy and willing to change this when price dictates and there are a few warning signs that exhaustion may be setting in, although if the S&P 500 pushes higher we’ll see higher levels. Firstly, price seems reluctant to close above the March highs, however my market internal model is starting to get very much overcooked. As seen in the Bloomberg chart, the percentage of companies now above their 200-day moving average is 71% and the highest May 2015. Generally we tend to see the ASX 200 top out when this percentage moves into 75%-80%. We are also seeing 38% of companies at four-week highs, which is naturally bullish, but the index generally tops out at 40-45%. So a few red flags in the internals suggest we could see a pullback. One suspects we need the USD, oil and the S&P 500 to react first.

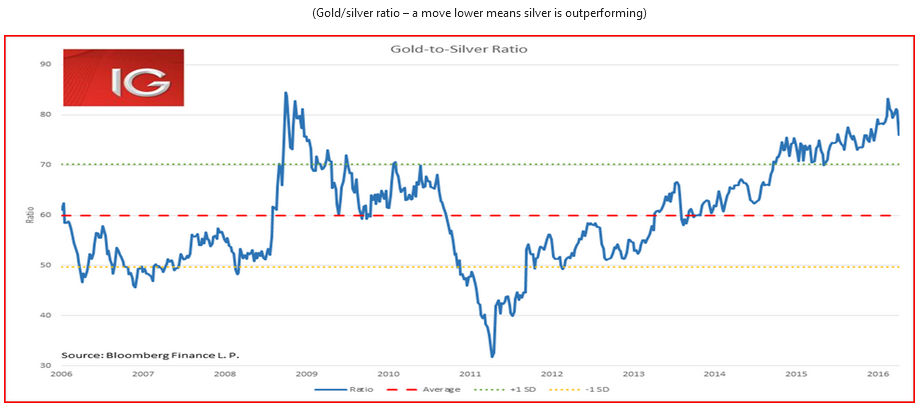
However, if all else fails, just be long silver as everyone else seems to be at the moment, and the daily chart looks really bullish. My preference is to be short gold and long silver as a pair’s trade. It seems we could be in for some strong mean reversion (for more information on pairs trading, please reach out).

Ahead of the open IG are calling the FTSE at 6385 -20, DAX 10330 -19 and CAC 4557 -9
