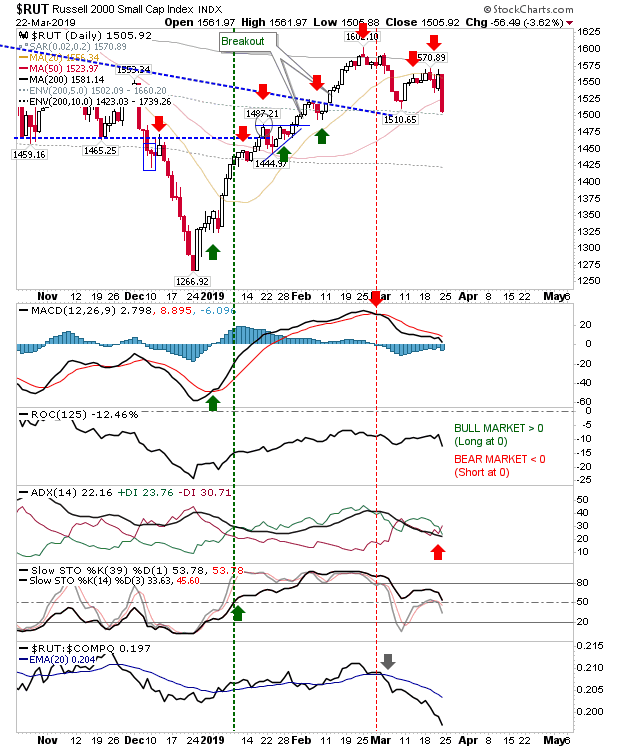
The Russell 2000 was unable to make it past its 20-day MA as it reversed through its 50-day MA. The loss didn't make a huge technical difference as relative performance was already falling off a cliff, the MACD was already on a 'sell' trigger, and only -DI/+DI switched to a new 'sell' trigger. The next target is 1,444 which was the last swing low in January. Bulls will need to do a lot of convincing if this is to get near its 200-day MA anytime soon, so I would be looking for this bearish scenario to spread to other indices
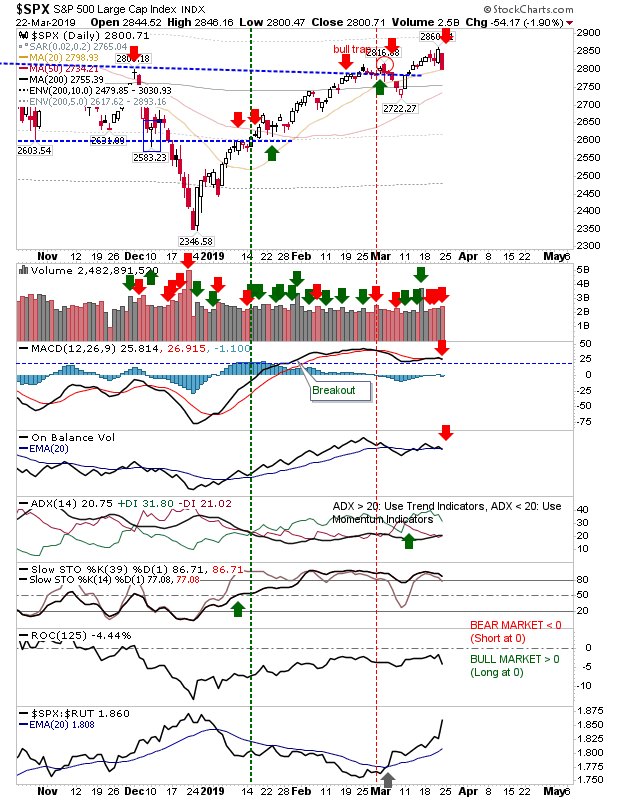
With Small Caps leading losses lower it won't be long before other indices start feeling the pain. First strike on Large Caps was Friday's loss; in the case of the S&P there was a new all-time high on Thursday before Friday's near 2% loss struck. Friday's loss coincided with a 'sell' trigger in the MACD and On-Balance-Volume. This loss may be enough to register a new 'short trade' for the index which I have marked on the chart.
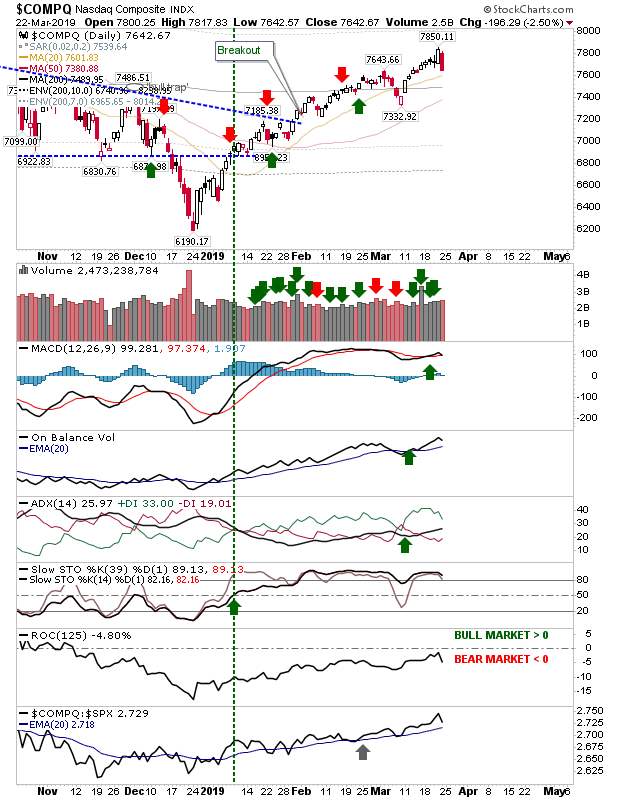
The NASDAQ suffered a 2.5% loss but it was not associated with a supporting technical 'sell' from indicators. While 20-day MA support is nearby I suspect the next real test will be the 200-day MA at 7,490. I'll be looking for more declines in the coming week with the Russell 2000 is freefall mode.
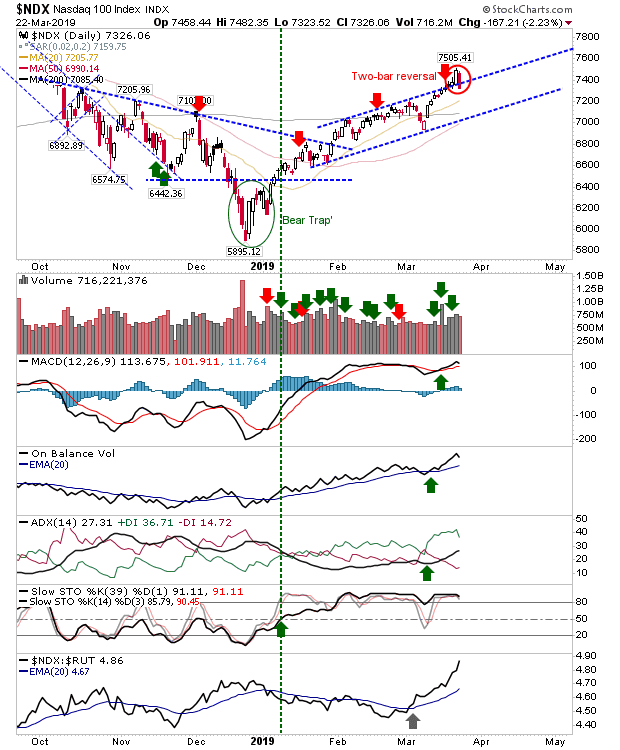
The NASDAQ 100 also posted a two-bar reversal which returned the index inside the rising channel. Of all the indices it has the best technical strength. The index has a little more of a buffer to its 20-day MA than the NASDAQ so buyers may feel more confident defending here first, although typical in false breakouts is a rapid fall back to channel support—before there is a quick break of said support.
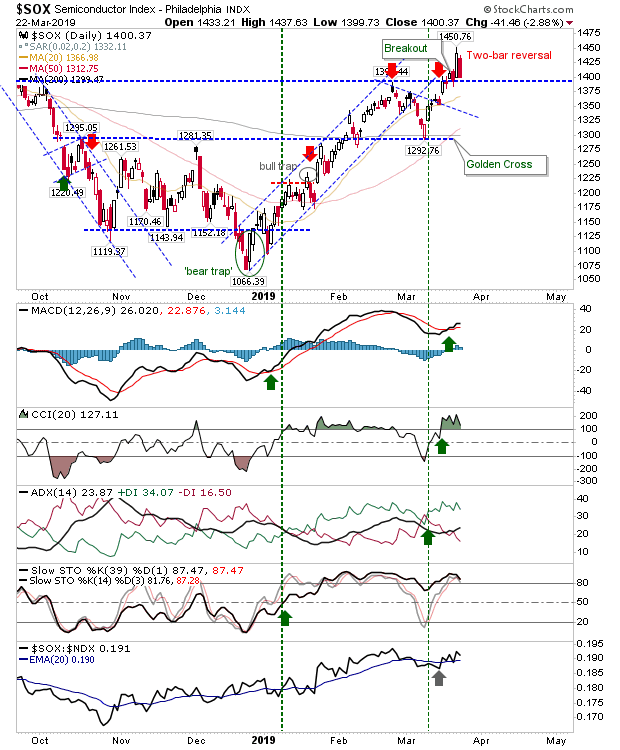
Semiconductors also had a two-bar reversal, although this was not before Thursday's gain negated the February-March double top. Other bullish factors include the 'Golden Cross' between the 50-day and 200-day MA. While the two-bar reversal is often a powerful reversal signal there is proximity support to work with, chiefly former resistance of the double top at 1,390 but also the 20-day and 50-day MAs. Technicals are all bullish.
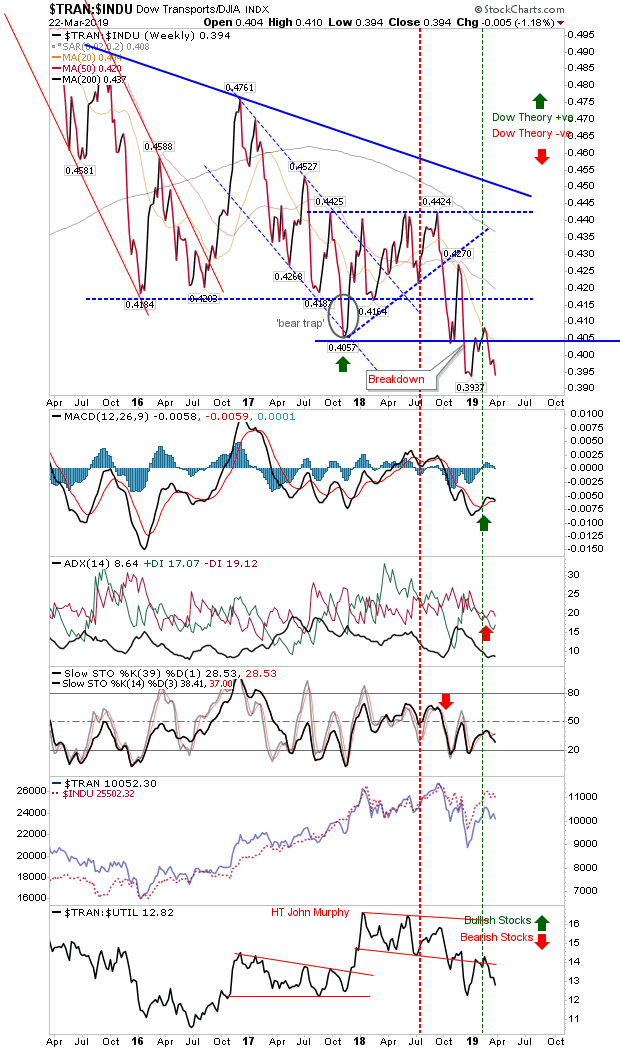
Of the breadth indices I follow, the relationship between the Dow Transports and Dow Jones Index took another step lower, continuing its freefall decline. This period of relative Transport under-performance dating back to 2015 has yet to be unleashed on the market, but it's hard to see how long the market can remain immune to this.
It remains to be seen what, if any impact Friday's Mueller's report will have on Monday's trading action. But given the Russell 2000 has been struggling since the middle of February I would not be expecting any bullish reaction to last very long without something more concrete economically to back it.
