Friday's action in the indices didn't do a whole lot, but what it did do was help carry last week's breakouts through the weekend. The breakouts were fairly modest and overhead resistance in the shape of 200-day MAs is still a concern for some indices, but last week's action is favorable for bulls.
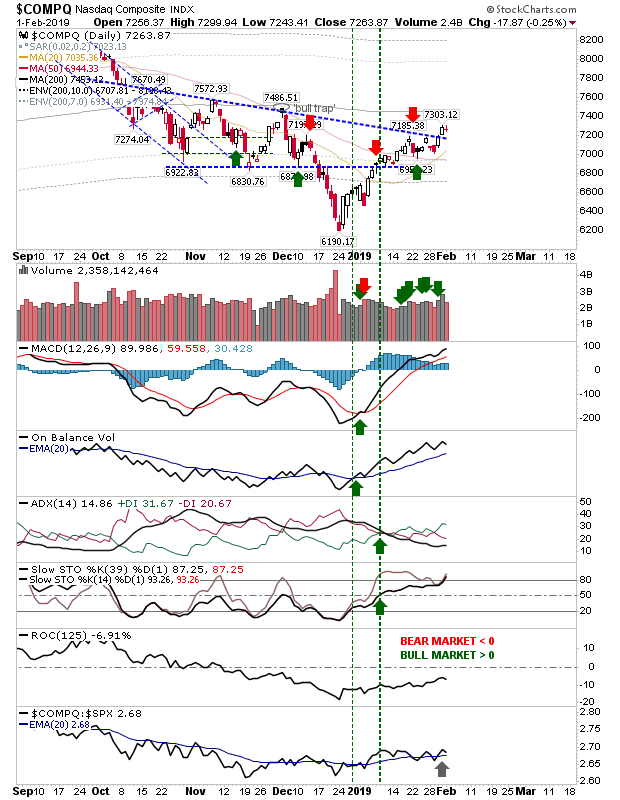
Tech indices were the primary driver last week with the NASDAQ clearing declining resistance with a decent looking breakout on higher volume accumulation; better still is the sharp advance in on-balance-volume—a sign of sustained interest from Big Money to participate in this rally. The NASDAQ does enjoy a relative performance advantage against the S&P, the question is whether it can sustain it. It still has the 200-day MA to overcome but momentum and short term traders may still be able to eke out a trade on a test of this key long term moving average.
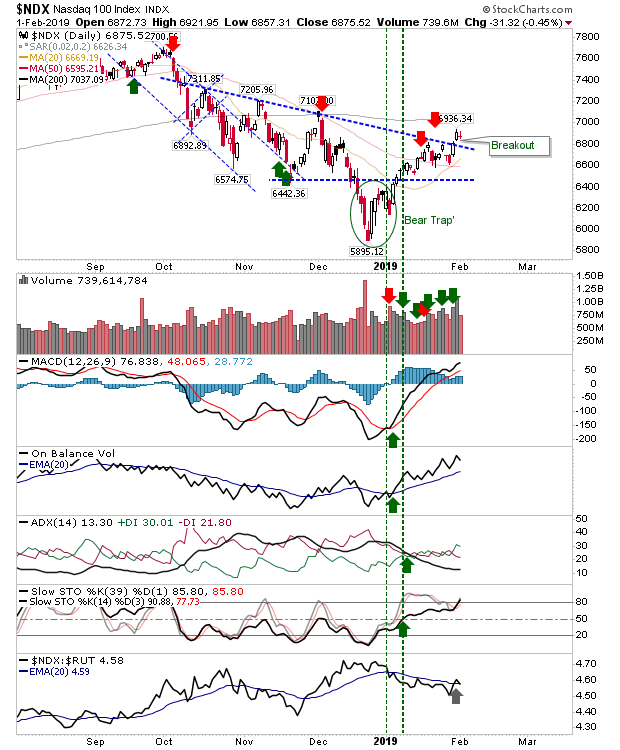
The NASDAQ 100 is in a similar position to the NASDAQ with the same goal for a push to the 200-day MA as a starting play for traders.
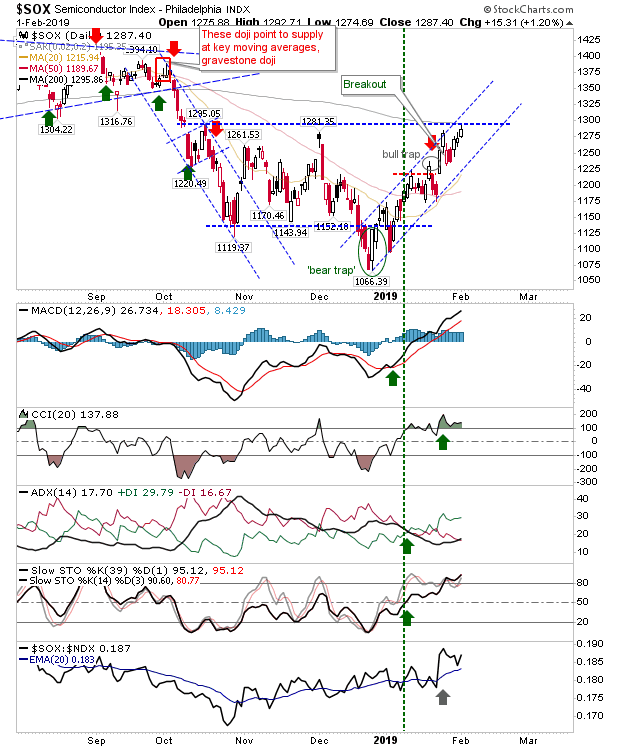
Both the NASDAQ and NASDAQ 100 are helped by the growing strength of the Semiconductor Index. This index is pressuring horizontal resistance as relative performance enjoys a jump against its sibling NASDAQ 100. Note, this index has already surpassed its 200-day, which is good news for both the NASDAQ and NASDAQ 100 (to do likewise).
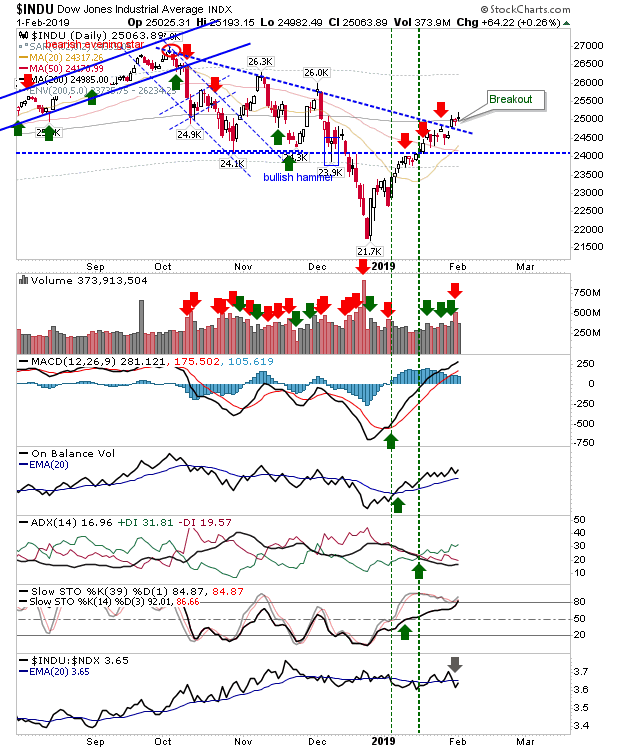
Of Large Cap indices, the Dow Jones Industrial Average has cleared declining resistance from the October all-time high and has also made it past its 200-day MA. Relative performance has ticked a little lower against the NASDAQ 100 but it does have a price advantage in being over its 200-day MA
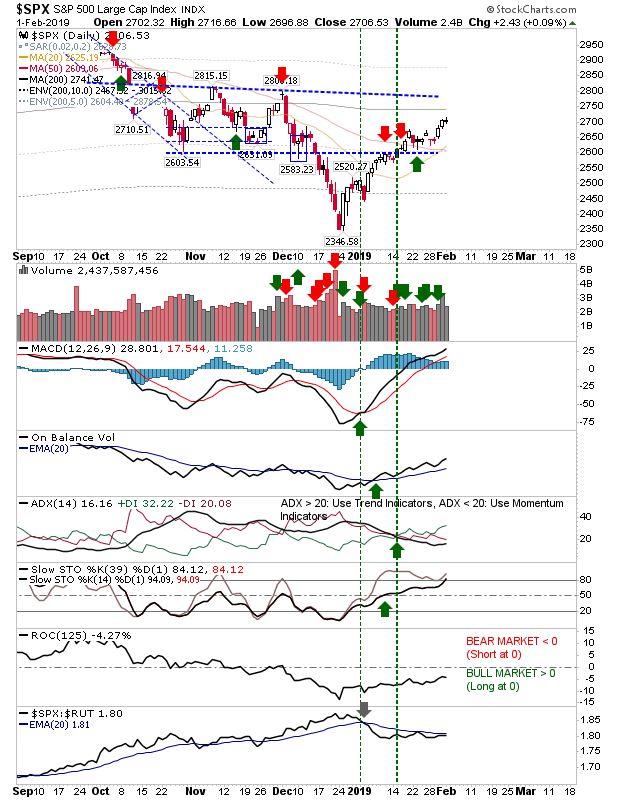
The S&P is lagging a little behind the Dow as it's still to break its 200-day MA. The index is underperforming the Russell 2000—which is no bad thing as bulls want to see money flow into more speculative issues than defensive Large Cap stocks.
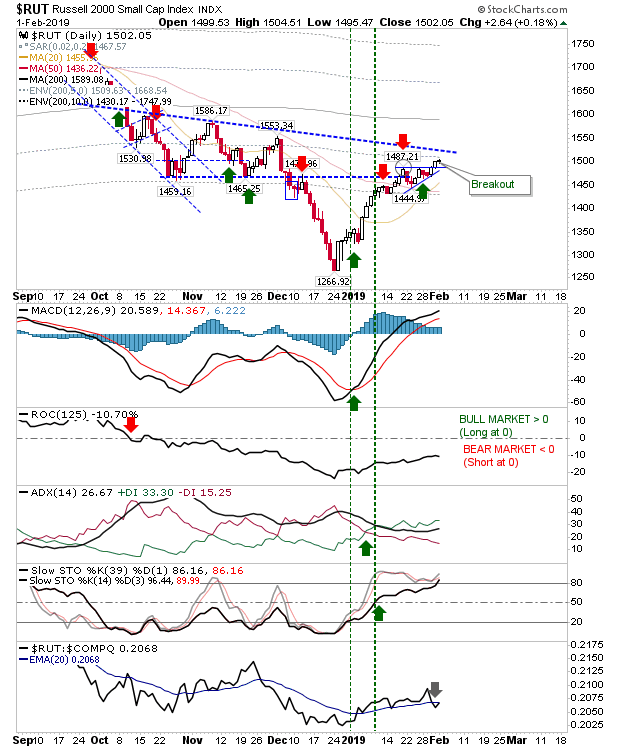
Speaking of the Russell 2000, it edged a breakout but it has a long way to go before it can challenge its 200-day MA. The index is struggling a little in relative performance (ahead of Large Cap but behind Tech indices) but it's not without bullish momentum.
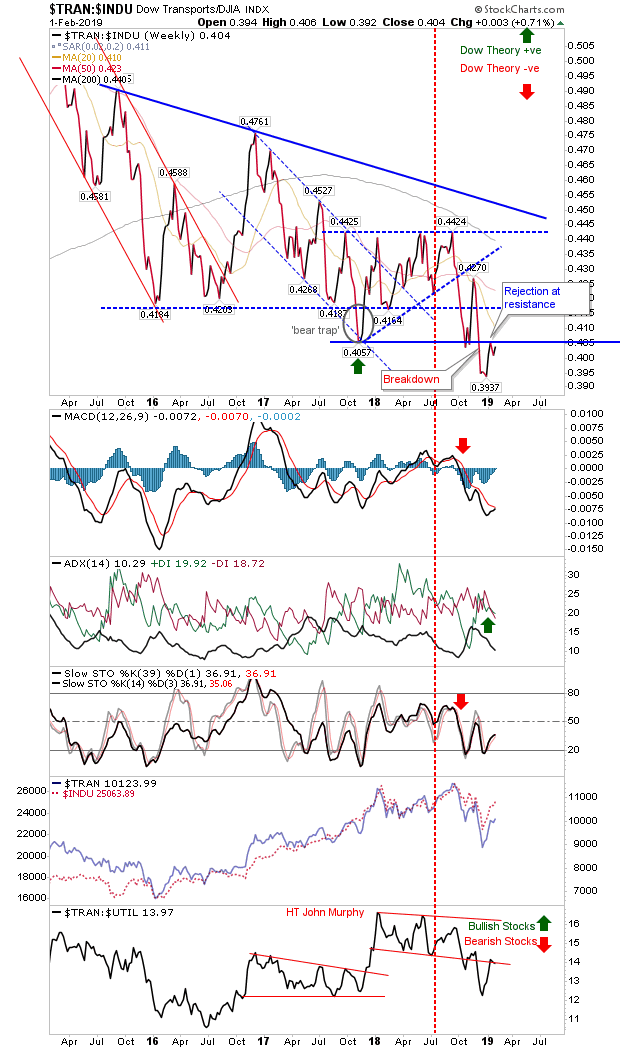
Of other charts, the relative relationship between the Dow Transports and Dow Indices is rebounding off resistance defined by the last swing low; this relationship is in a multi-year decline and is Dow Theory says, it's reflecting underlying weakness in the economy (an aspect not reflected in either consumer sentiment or unemployment figures).
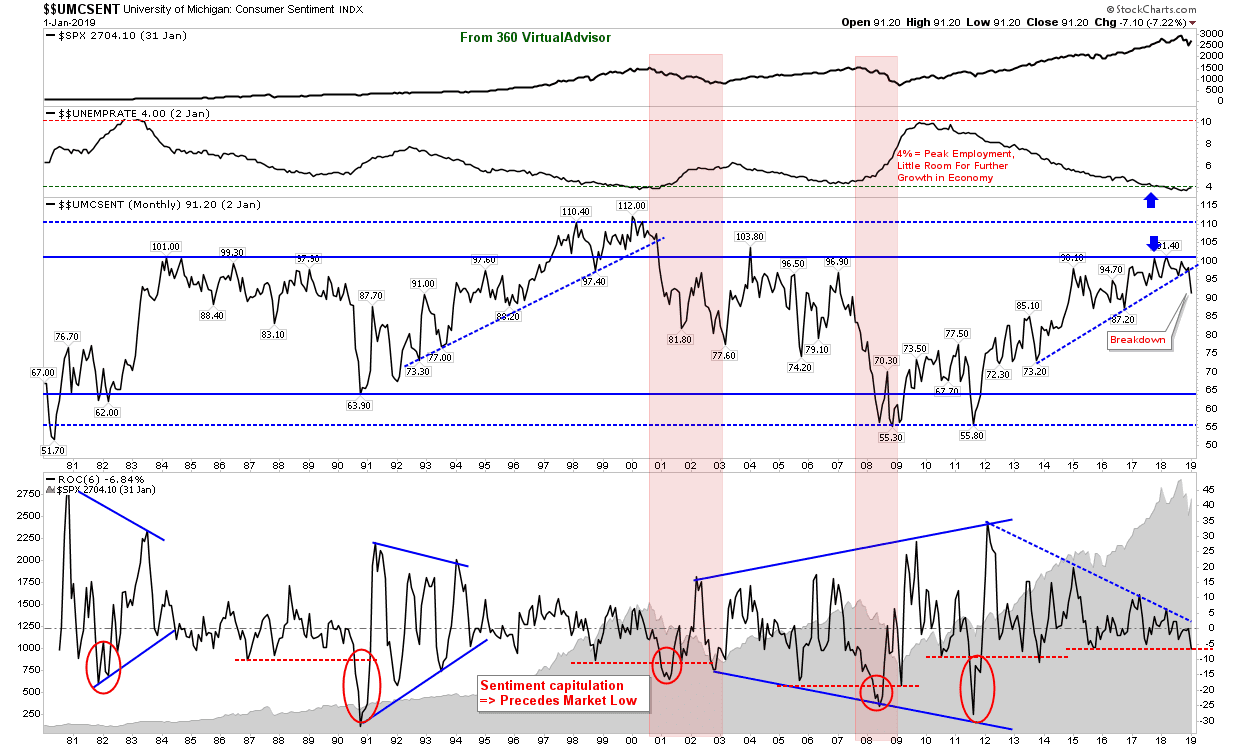
Speaking of... consumer sentiment has only started to roll over, but unemployment has yet to break.
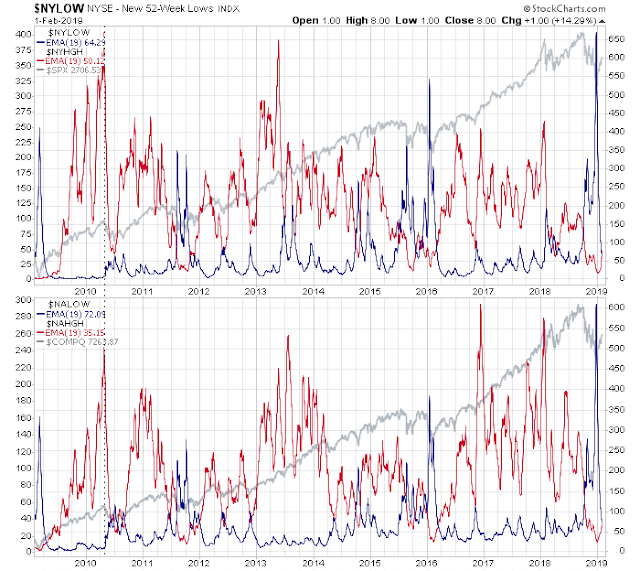
The chart of 52-week new NYSE highs and lows, had the largest spike in new lows over the last 10 years which suggests the recent swing low is of substance
The Percentage of NASDAQ stocks above the 200-day MA also came close to tagging a line which has marked the major lows of 2002, 2009, and 2011. Another tick in the column to suggest that the December low is a major low.
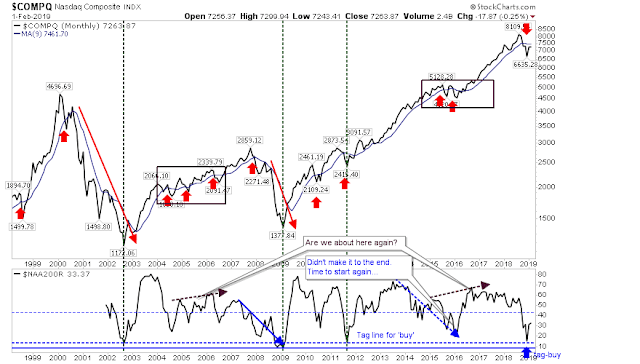
What all these charts together suggest is that the current bounce has further upside to come, but it may only turn out to be a bear rally which means the next down leg could retrace most of this gain. Investors should be excited if this happens; the early investor 'buy' trigger from November has seen the market rally to a frequency of one-buy-a-month over a 12- to 18-month accumulation period.
I'll let you know when you can accelerate this accumulation, but for now, buy small and spread your investment over time. If you missed the December deep value buying opportunity, other chances will present themselves.
