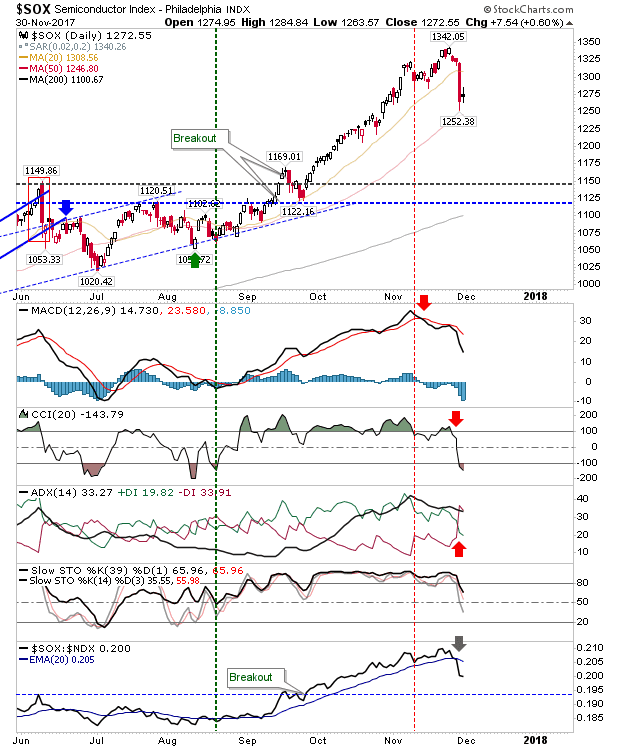
There was a clear shift in market behaviour as Large Caps enjoyed the fruit of renewed buying as Tech indices (Semiconductors mostly) felt the heat of profit taking.
After weeks of tight gains in the Semiconductor Index it was an easy turn for profit takers to come in and push the market down; in the absence of logical support it was going to be a hard task to pinpoint where potential depend may lurk outside of 1,150. The 50-day MA may provide one such escape but there isn't a whole lot to suggest it may play as support.
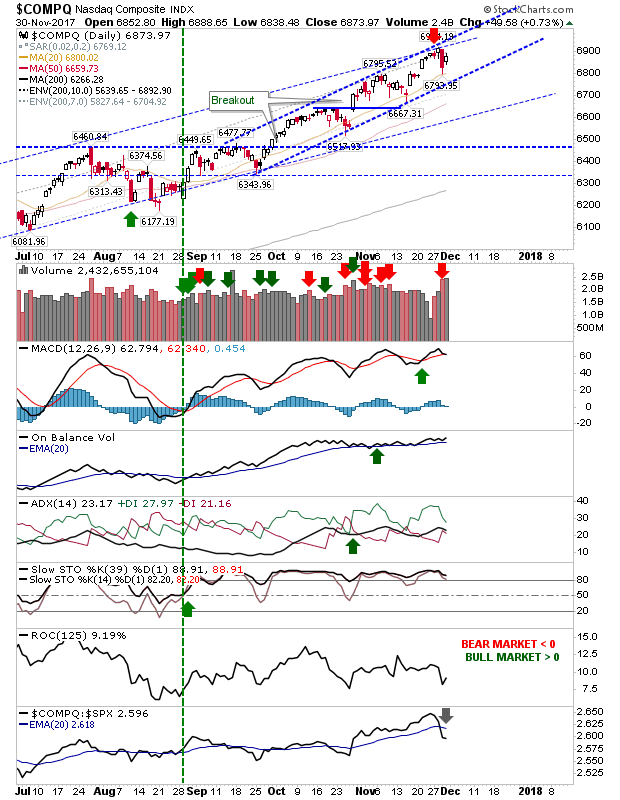
The NASDAQ peeled away from resistance but it made a sufficient recovery to suggest it might yet make a fresh challenge on newly created channel resistance. Wednesday's action still gives shorts something to work with but the risk of these trades getting stopped out (on a return above 6,900) remains quite high.
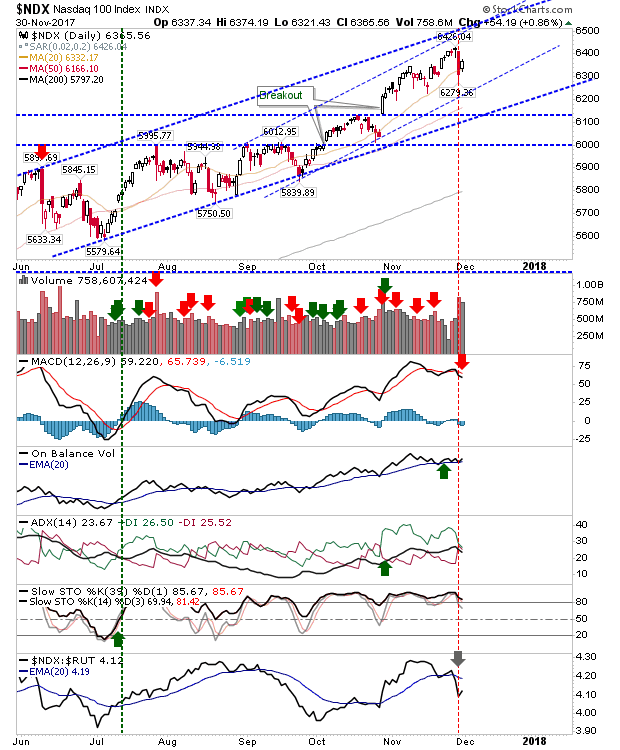
The NASDAQ 100 has a broader channel and it remains on course to tag such resistance. Technicals are mostly positive with the exception of the 'sell' trigger in the MACD.
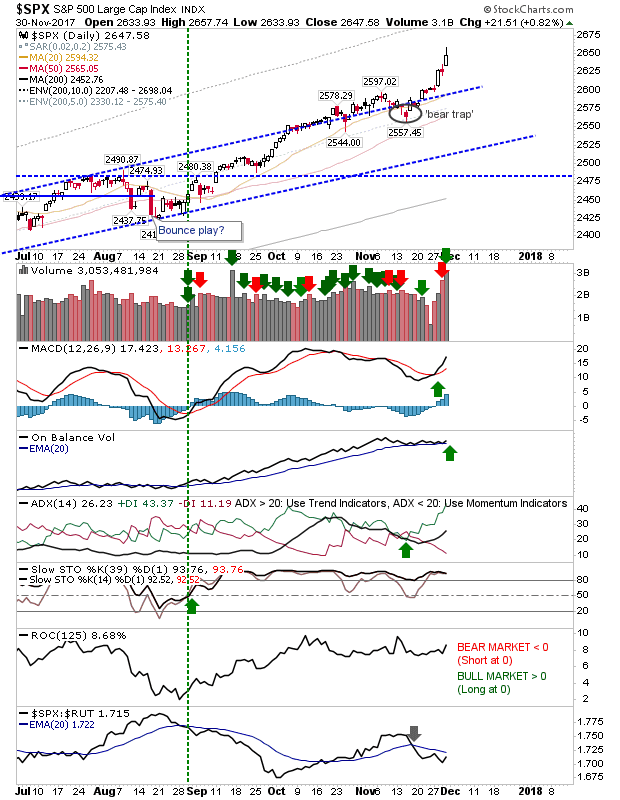
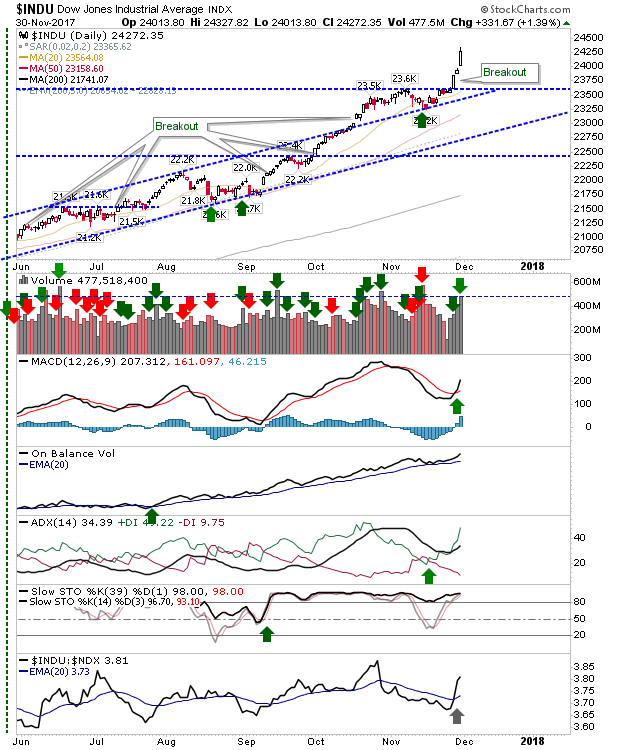
It was a different story for Large Caps. In a clear divergence to other indices both the S&P and Dow Jones Industrial Average accelerated gains in what looks to be an early parabolic move – or at least an acceleration of the prior trend. For the S&P this came with higher volume accumulation but not a marked improvement in relative performance (vs. the Russell 2000).
Although Large Caps have enjoyed a marked improvement against Tech averages, the Dow has enjoyed particular success since Trump's election.
Only the Russell 2000 was a little disappointing. The index had gained as other indices did on Wednesday but it struggled to hold early intraday gains. It finished with an inverse doji which may mark a reversal top; although losses starting in the morning would be required to confirm such a possibility.
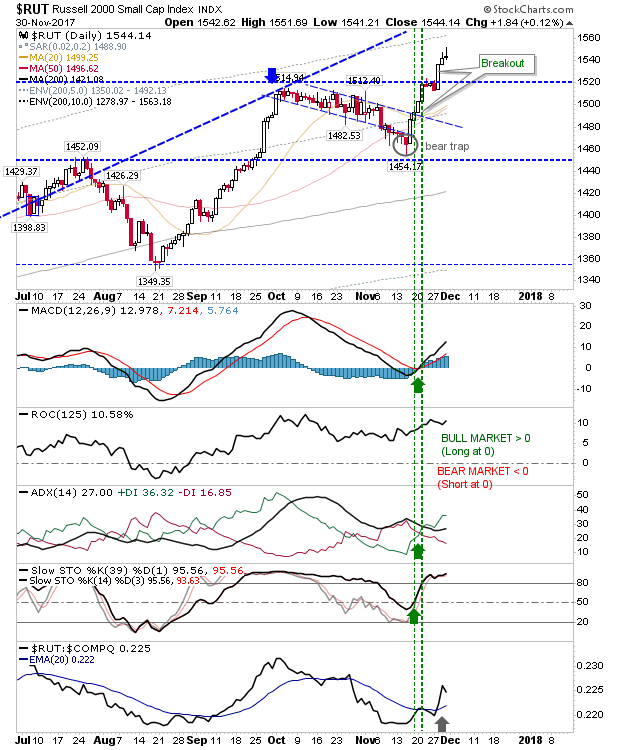
For Friday, watch for a weak bounce of the Semiconductor 50-day MA – this will likely be a shorting opportunity. If the NASDAQ is able to recover it may yet follow the gain of Large Caps with a push above channel resistance. There isn't much to work with for the Russell 2000; losses bring into play the chance for a larger pullback, but with relative performance and supporting technicals so strong it's hard to see any selling pressure lasting longer than a few days.
