by Pinchas Cohen
Key Events
Global stock momentum is heating up. Asian equities advanced for a ninth consecutive day, fired by yet another US equity record, and after the Bank of Japan, as expected, kept its unprecedented monetary stimulus. European stocks followed global counterparts higher.
Global Affairs
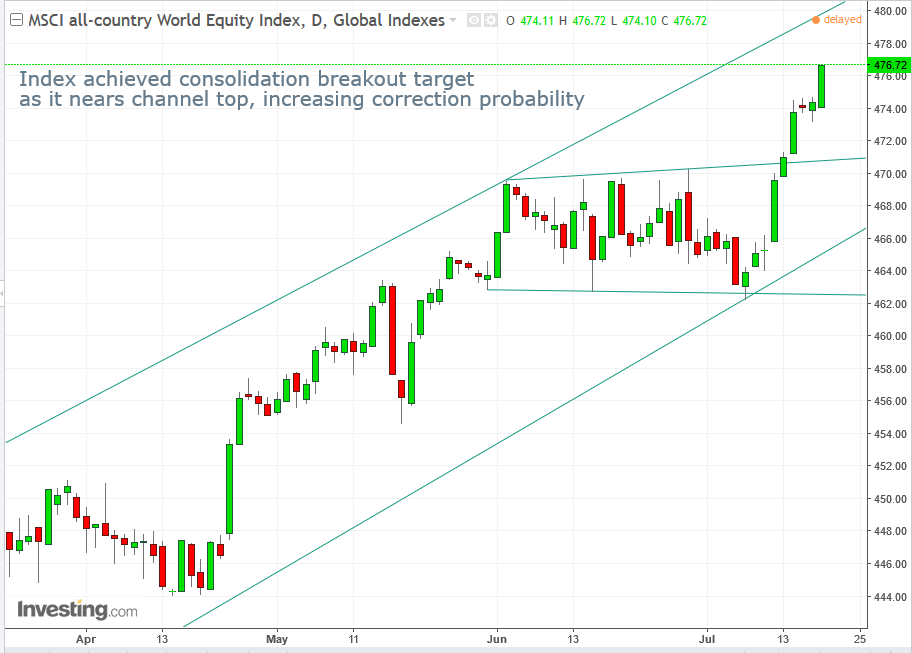
Yesterday, the S&P 500, the NASDAQ Composite, NASDAQ 100 and the Russell 2000—every major US index but the Dow Jones—recorded both record closes and all-time-highs. Today, indices from Tokyo to Sydney followed the advance, bringing the MSCI All-Country World Index to a record high.
US stocks continued to surge yesterday after the release of strong earnings reports from among others, Morgan Stanley (NYSE:MS), American Express (NYSE:AXP) and US Bancorp (NYSE:USB), even as the US economy’s growth is slowing. The stock market is considered a leading indicator, in that it rises before signs of an economic pickup are visible and it falls before any hints of a slowdown. That may reconcile the apparent divergence between the US stock market and the country's economy.
On the other hand, how reliable is this "leading indicator” when companies can create growth because the Fed is providing easily available money? Since this is an unprecedented situation, there is nothing in either the books or in normal experience to help answer that question. Only time will tell.
Japan
The Bank of Japan delayed its forecast for reaching 2-percent inflation for the sixth time, cutting its forecast for that target to March 2019. Their current inflation prediction calls for a move from 1.7 percent to 1.5 percent.
BoJ and What Drives the Yen
The Market narrative has it that the BoJ’s continuous balance-sheet buildup is moving on a divergent path to that of the Fed and ECB. This remains to be seen, after Reuters reported that the ECB is keen on keeping its QE program open-ended—just as the BoJ just did—and after US inflation momentum has consistently been on the downside since its February 2.7 peak.
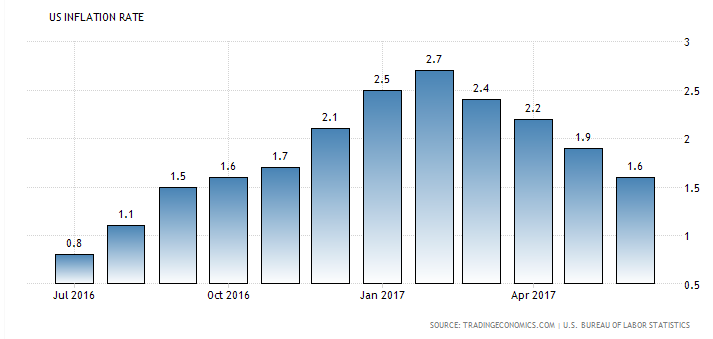
Either way, the near-9 percent gain for the yen from January to mid-April was when the inflation divergence between the US and Japan was the widest, clearly proving that the JPY's strength is irrespective of its stimulus.
There is simply more demand for the yen than for the dollar, on Japan’s current account surplus—which reached its 9-year high in March—with countries buying the yen to pay for Japanese goods. While its current account nearly halved from the JPY 3-trillion in March to the current JPY 1.65-trillion, it’s still considered within an uptrend on a 5-year view, even if it might be peaking at the 3-trillion level.
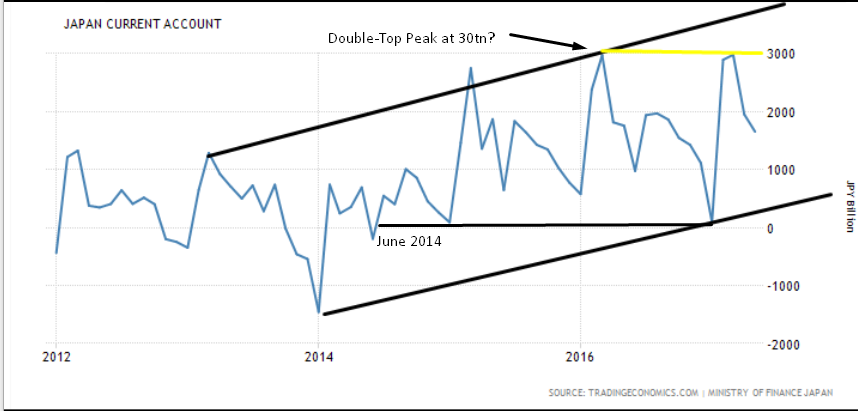
Look at the Japan Current Account trend and note that it climbed while oil fell. With almost 3.5 million barrels a day, Japan is the world’s third largest oil importer on the IndexMundi. So, when the price of oil falls it increases Japan’s current account surplus.
Sometimes, however, there's a more compelling reason for foreigners to buy the yen than to pay for Japanese goods—as a safe haven, in order to protect their capital during market upheavals and times of uncertainty. Naturally, the balance of the two causes of demand are always present, but depending on global and/or economic events their weight continuously shifts.
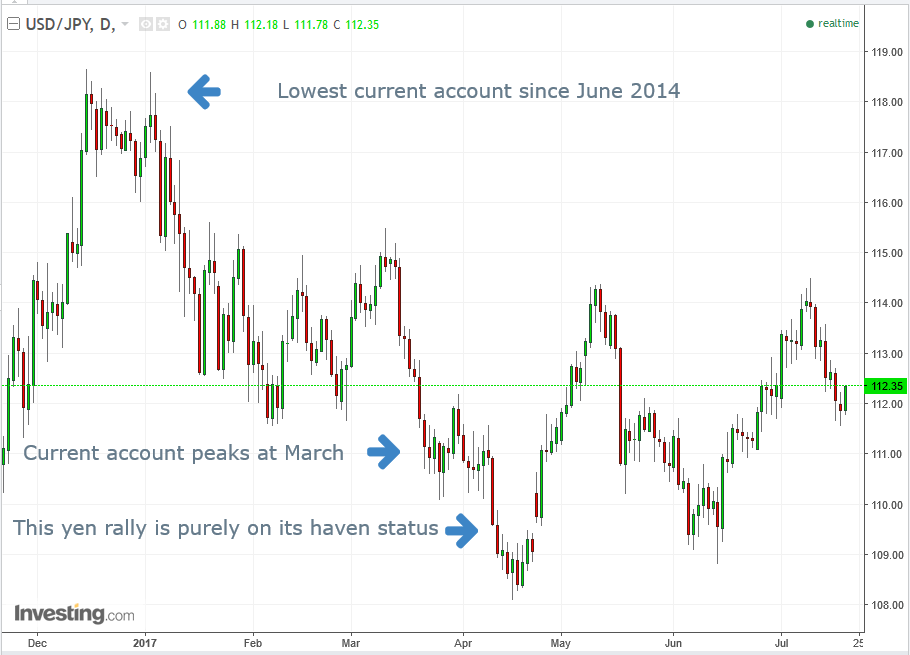
Note that while the pair topped, or the yen bottomed, it converged with its lowest current account since June 2014. From that point forward, the current account rose, leading other countries to demand more yen, pushing the currency higher. While this tendency started here, it elevated the currency’s safe haven status.
While the current account peaked in March and has since fallen, the yen continued its climb until mid-April. It just so happened that during that time stocks declined, and gold and Treasuries advanced along with the yen.
Europe
European equities have followed Asian markets higher, as investor focus now turns to today's ECB’s meeting for some clarity. In March, Executive Board member and ECB Chief Economist Peter Praet opposed raising the interest rate before the end of bond purchases, while Benoit Coeure, in charge of ECB market operations, said the discussion is “not a taboo.” These are ECB President Mario Draghi’s lieutenants and most influential members on the six-person board that recommends ECB policy.
In June, Draghi was understood to imply that shrinking the balance sheet may begin sooner than initially anticipated thanks to the eurozone’s best economic growth since before the 2008 Recession, which sent the euro surging. Then, his VP quickly attempted to quell a surging market by saying that investors misunderstood his boss: he only meant to say what he has always said, that everything is on track and looks good. He went as far as insulting investors, saying their reactions are hard to understand. Traders ignored him; after a very brief and very shallow dip, the euro kept climbing until it recently broke its 2-year downtrend line.
Has Draghi been misunderstood? For anyone listening, that would be a hard sell. Like Fed Chairwoman Janet Yellen, he chooses his words carefully, while remaining eloquent, sharp and on-point. If he doesn’t have a clarity issue, the remaining option is a decision problem. There is obviously disagreement among the board. Perhaps, Draghi himself doesn’t know where the stream leads, and he is simply wading through its murkiness.
US
Meanwhile, US bonds rally and the dollar falls, as investors scale back expectations on economic growth by Trump reflation. After the Fed tempered its monetary stimulus plans, the Trump administration’s healthcare setback foiled any hope of any stimulus, from any corner, coming to fruition. Investors, accordingly, have lowered their outlook on higher interest rates to less than 50 percent this year—despite the Fed’s insistence that it's likely to happen.
Oil
Oil is holding onto yesterday’s gains, as the EIA confirmed the API report that stockpiles decreased. From a technical perspective, the July 5, $47.32 peak resistance held. The price climbed today to $47.36, but was pushed back down to $47.19 as of 3:17 EDT.
Up Ahead
4:30 – UK: Retail Sales (June): expected to rise 0.8% MoM and 2.3% YoY, from -1.2% and 0.9% respectively. Market to watch: GBP crosses
7:45 – ECB: Rate Decision (press conference at 1.30pm): no change on policy expected, but some discussion of the outlook on quantitative easing (QE) is likely. Markets to watch: eurozone indices, EUR crosses
8:30 – US: Initial Jobless Claims (w/e 15 July): 247,000 claims expected, from 246,000 a week earlier. Markets to watch: US indices, USD crosses
10:00 – Eurozone: Consumer Confidence (July, flash): expected to rise to -0.6, from -1.3. Markets to watch: eurozone indices, EUR crosses
Earnings
eBay (NASDAQ:EBAY) is scheduled to report earnings after market, with an estimated $0.36 EPS, flat YoY, on $2.31B revenue with $40.13B market cap.
Microsoft (NASDAQ:MSFT) is scheduled to report earnings after market, with an estimated $0.71 EPS vs $0.69 YoY, on $24.26B revenue with $561.90B market cap. With shares of the global technology giant at all-time highs, is the stock a buy?
Market Moves
Stocks
- The MSCI ACWI Index was up 0.1 percent at a record high as of 3:05 p.m. in Hong Kong.
- The Euro Stoxx 50 climbed 0.4 percent, building on Wednesday’s 0.6 percent gain.
- The FTSE 100 gained 0.6 percent yesterday, advancing 0.3 percent.
- S&P 500 futures were unchanged after the underlying gauge rose 0.5 percent to a record 2,473.83 on Wednesday.
- Australia’s S&P/ASX 200 Index gained 0.5 percent.
- Japan’s TOPIX rose 0.7 percent to close at its highest in nearly two years.
- The VIX closed below 10 for a record fifth consecutive day.
Currencies
- The Aussie traded down 0.3 percent at 79.25 U.S. cents after reaching a two-year high of 79.89 cents, on a characteristically volatile monthly jobs report for June which showed a surge in full-time employment. It’s the best-performing G-10 currency this year, climbing 10 percent.
- The yen slipped 0.1 percent to 112.12 per dollar.
- The pound and euro were flat.
- The Dollar Spot index gained 0.3 percent, paring its weekly loss to 0.1 percent. The dollar was up against all major Asian currencies bar the Philippine peso, which strengthened 0.2 percent.
Commodities
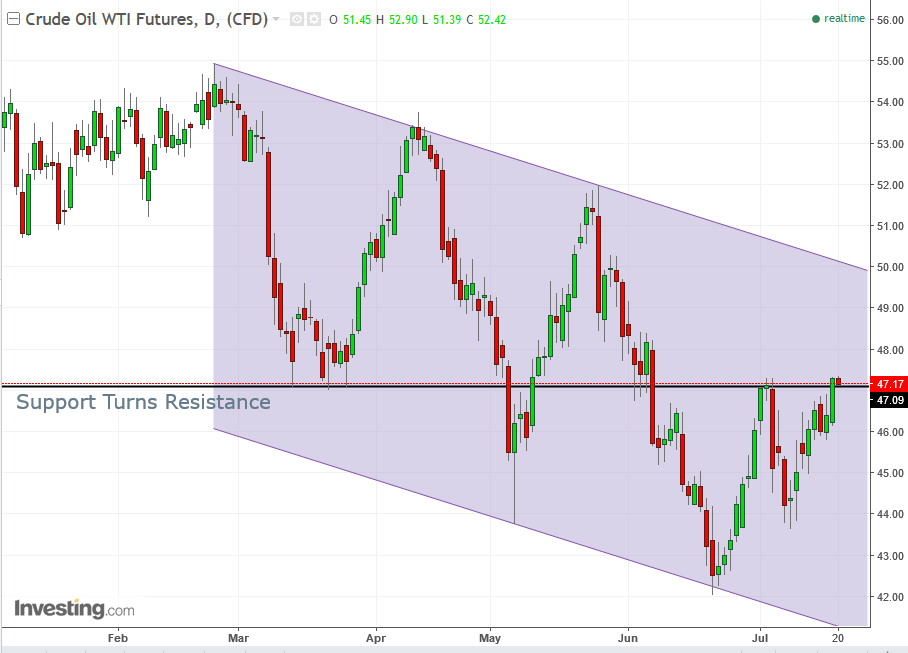
- WTI crude was flat, after surging 1.6 percent Wednesday, when government data showed U.S. crude and gasoline stockpiles continue to fall, allaying anxiety about a supply glut.
- Gold was 0.2 percent lower at $1,239.28 an ounce.
Bonds
