- After record closes, US futures are trading lower
- Bitcoin surged on news Tesla purchased $1.5 billion of the cryptocurrency
- The dollar is falling for the third day,
- The EIA crude oil inventory report is released Wednesday.
- Sweden will set monetary policy on Wednesday.
- Federal Reserve Chairman Jerome Powell is speaking at a webinar on Wednesday.
- The US consumer price index is published on Wednesday.
- The Bank of Russia’s announces its interest rate decision on Friday.
- Futures on the S&P 500 Index decreased 0.1%.
- The Stoxx Europe 600 Index fell 0.2%.
- The MSCI Asia Pacific Index advanced 0.4%.
- The MSCI Emerging Markets Index gained 0.4%.
- The Dollar Index fell 0.4 to 90.57%.
- The euro advanced 0.4% to $1.2098.
- The British pound increased 0.3% to $1.3782.
- The onshore yuan strengthened 0.2% to 6.435 per dollar.
- The Japanese yen strengthened 0.5% to 104.72 per dollar.
- The yield on 10-year Treasuries decreased two basis points to 1.15%.
- The yield on two-Year Treasuries was unchanged at 0.11%.
- Germany’s 10-year yield declined one basis point to -0.45%.
- Britain’s 10-year yield sank one basis point to 0.466%.
- Japan’s 10-year yield increased less than one basis point to 0.073%.
- West Texas Intermediate crude climbed 0.3% to $58.13 a barrel.
- Brent crude increased 0.4% to $60.80 a barrel.
- Gold strengthened 0.8% to $1,845.56 an ounce.
Key Events
Futures for the Dow, S&P, NASDAQ and Russell 2000 as well as European stocks were marginally in the red on Tuesday as traders appear to be taking profit after recent gains, while waiting for a new, market-moving catalyst. Global equities are currently trading at record highs on the back of a strong earnings season and the possibility of inflation rising for the first time in over a decade.
Gold and oil are continuing to head higher.
Global Financial Affairs
Non-tech indices have posted their longest rallies since August, propelled by expectations that further fiscal stimulus, continued support from the Fed and the ongoing rollout of the coronavirus vaccines will put the economy back on track.
In Europe, the STOXX 600 Index fell, despite upbeat earnings from French oil giant Total (PA:TOTF) and online grocer Ocado (LON:OCDO). Some market watchers are attributing this pause in the stock market rally to “cooling off.” However no rationale for this opinion has been provided.
Without a fundamental driver pressuring equities, we view the current dip as profit-taking after strong gains. But perhaps the rationale is actually technical.
Today’s pan-European benchmark's decline follows Monday’s shooting star after the price tested a resistance level since Jan. 8, which was enough to push the price below the uptrend line since the Oct. 29 bottom.
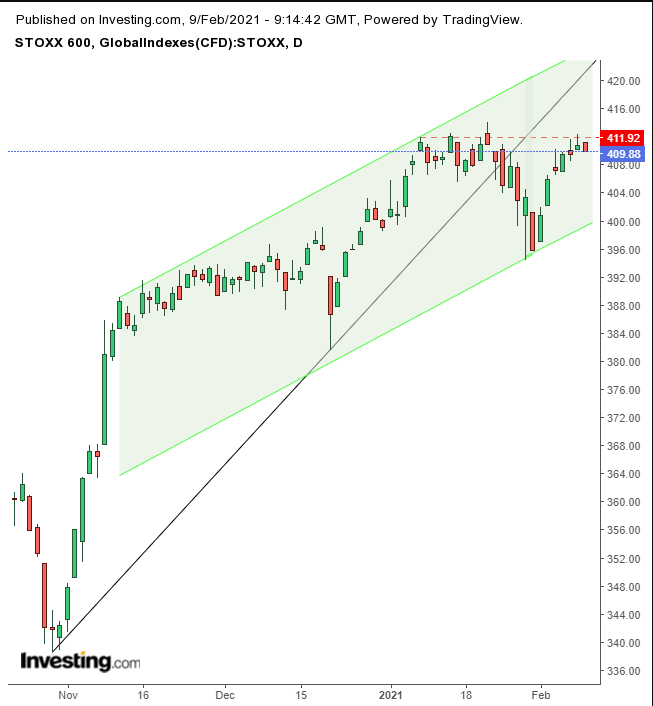
However, this pressure will not necessarily end the uptrend line's trajectory though it may just slow it down, as shown with the green rising channel.
Most Asian indices advanced, after Monday's record-setting Wall Street session. MSCI’s broadest index of Asia-Pacific excluding Japan rose 0.3%, to within 0.2% from the Jan. 25 record.
China’s Shanghai Index (+2%) outperformed, thanks to containment of a resurgence of locally transmitted virus infections, reassuring investors that the Sino economic recovery will continue. The country’s blue-chip index closed at its highest level in 13 years, with rare earth stocks leading the rally further into nosebleed territory. The CSI 300 Index closed 2.2% higher, the highest for the benchmark since Jan. 15, 2008, when global markets topped out before the 2008 crash.
In fact, stretched valuations have been giving investors pause—depending on news headlines and market pundit talking points—albeit sporadically.
US stocks have now registered their longest advance since August, boosted by comments from Treasury Secretary, and former Fed boss, Janet Yellen that President Joseph Biden’s massive stimulus plan will help the US economy. Biden's plan is expected to drive a decisive economic recovery and cause reflation, when rising prices help company profits grow, creating a positive ripple effect throughout the economy.
Inflation out of stagflation is a sign of growth as opposed to inflation when the economy is already at full capacity. When the latter occurs it chips away at consumer purchasing power, not the case currently.
When inflation rises, so does the expectation that the Fed will keep pace by increasing interest rates to control the inflation uptick. This outlook is what's now driving US yields, including on the 10-year Treasury note.
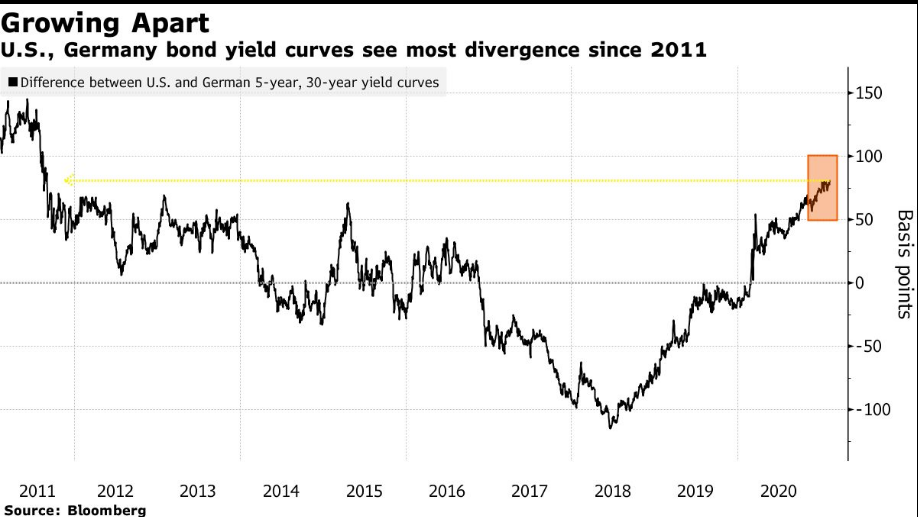
The spread between the 5-year and 30-year Treasury yield and the German yield curve on counterpart 5Y:30Y bunds is the widest since 2011, projecting estimates for stronger inflation in the US versus Germany.
Ironically, that same narrative is a reason for the dollar rally, though the greenback is falling for a third day. Previously, the global reserve currency sold off on the same fundamental news—additional stimulus—as it was seen to increase debt and the oversupply of USD units. From a technical stand point, the dollar appears conflicted, as well.
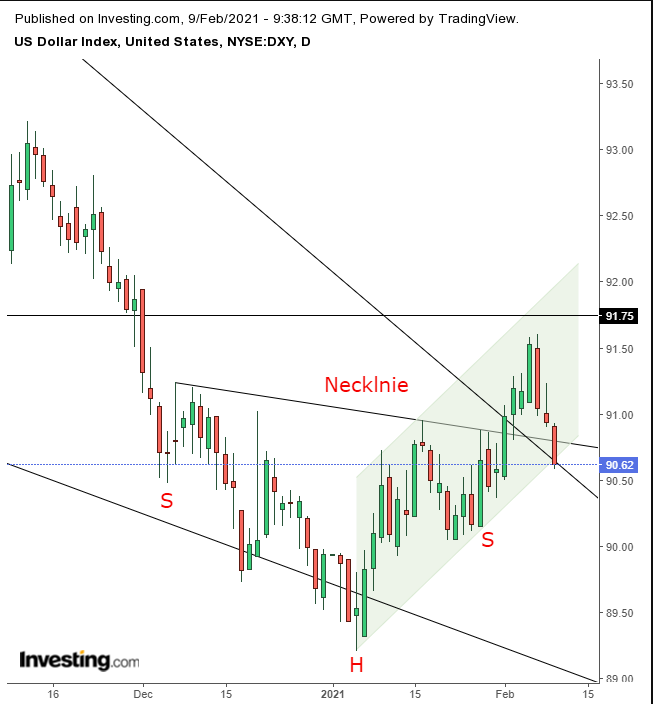
The greenback dipped below the neckline of a H&S bottom, as it tests the top of a falling, bullish wedge and the bottom of its rising channel since the Jan. 6 bottom. As long as these hold, we expect the dollar to rebound and continue higher.
Dollar weakness is pushing gold higher for the third strong day.
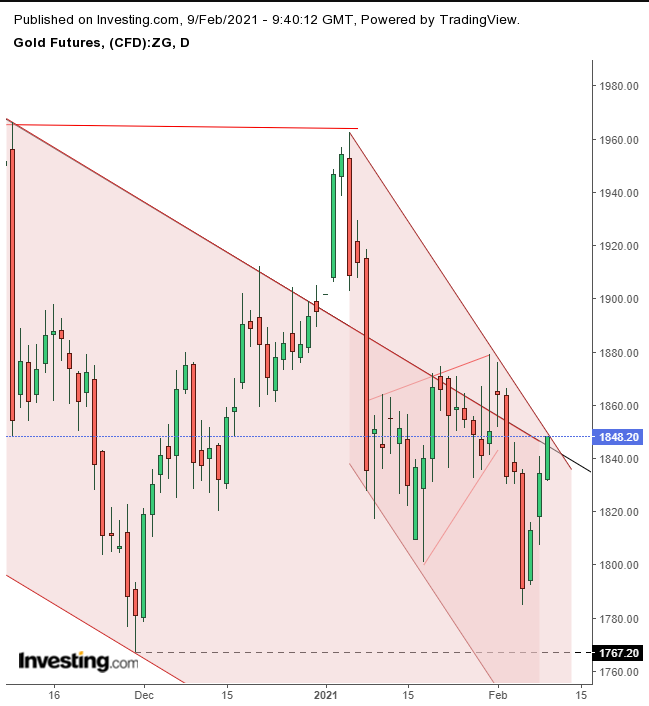
Technically, gold is triggering a return move, following the downside breakout of its rising flag, as it tests the falling channel top. This is according to the pattern, and as long as it remains within the flag, we expect the downward trend to resume. On Jan. 4, the yellow metal broke out of the falling channel but fell back into it on Jan. 8, entering a narrower, for now, steeper falling channel. This development keeps our trade in play and actually provides a dream entry.
Bitcoin surged 19.5% on Monday, after Tesla's (NASDAQ:TSLA) SEC filings revealed that it bought $1.5 billion worth of Bitcoin in order to be liquid in the currency. Founder and CEO, Elon Musk has recently been tweeting his support for the digital currency recently.
Putting his money where is mouth is, has a huge impact on Bitcoin, and could provide the stamp of approval the asset needs to gain mainstream acceptance. Bitcoin is now officially part of corporate America, having made it into the holdings of the S&P 500’s weightiest member. Cryptocurrency investment firm, Galaxy Digital analyst Michael Novogratz is forecasting that Bitcoin will more than double, and head to $100,000. For now, our $50K target has all but been reached.
Oil rose for the seventh straight day.
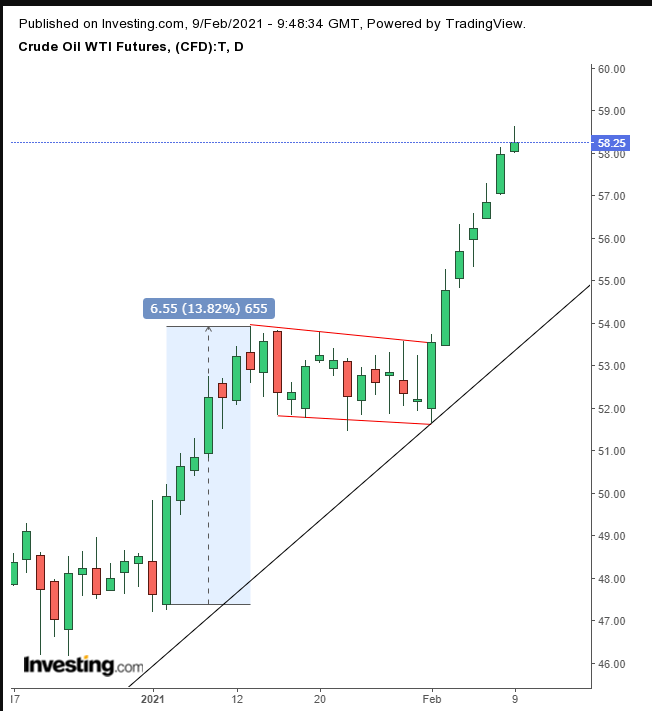
The move comes on the other side of a falling flag—a period of changing bulls—repeating the preceding sharp rally, as we predicted.
