Investing.com’s stocks of the week
Market fundamentals are currently lining up to pressure gold. As such, we expect the precious metal to head lower in the short- to medium-term. In particular, there are a pair of reasons bolstering the technical projections of another slump.
With markets now rising on the “reflation trade,” in which the Democrats’ massive stimulus plan is designed to revive economic growth after the current downturn, inflation is expected to reappear—for the first time in over a decade. That will be followed by rising Fed interest rates.
The economic recovery, amid reflation and the abundant, available cash for investing will boost equity prices. Increasing consumer spending will further buoy company profits, propelling equity prices even higher. Bottom line: stimulus will ramp up risk appetite.
In this scenario, we expect the dollar will strengthen while gold will be be sold off, both because the yellow metal's status as an inflation hedge is irrelevant under current economic conditions and because its standing as a safe haven asset isn't sought after during risk-on periods.
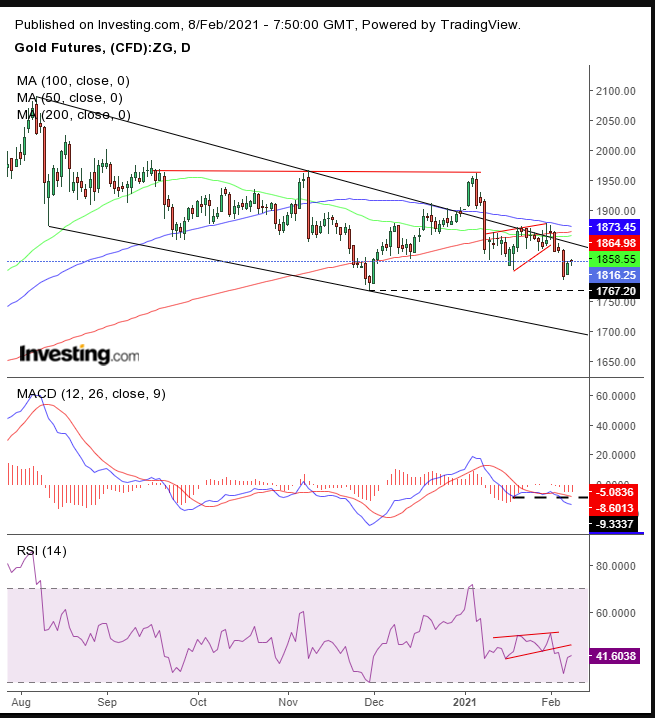
Gold's technical chart backs up the decline:

On Jan. 4, gold’s upside breakout from its falling channel failed when the shiny metal slipped back into that bearish channel on Jan. 8. It tried once more to break out but found resistance by the channel top.
Moreover, the 200 DMA reinforced the channel top at that price level. Finally, the 50 DMA crossed below the 200 DMA, triggering a death cross—all at the very same spot.
Since then, the price developed a rising flag. That's bearish after the 6% plunge within just three days that preceded the flag’s development, as sellers took profit, which included a buy order that supported the price, while new short sellers kept a lid on the flag’s upward tilt. When whoever wanted to cash out did, the second batch of bears forced gold below the flag.
The price then found support at the levels of the previous two lows, that of the flag on Jan. 19 and the Nov. 30 low, giving rise to a return move to retest the flag’s integrity, or simply another effort at short covering, until the presumed continued conditions will force gold further down, where the price will post below the Nov. 30 low, extending the downtrend since the March peak.
We have been considering the potential for a H&S top, whose neckline is marked by red, horizontal bar, but the flag and its completion lowered the odds for that scenario. When the price falls below $1,767, the possibility for this will have been erased, though there would still be the risk of a double bottom.
The RSI shows the same flag pattern/return move in momentum, and the MACD’s short MA found resistance by its longer one, then fell lower, reflecting the channel’s failed breakout and resumed downtrend.
Trade Strategies
Conservative traders should wait for the price to register a new low, then rise and find resistance.
Moderate traders would short when the current return move tops out, with at least one long, red candle.
Aggressive traders could short according to their timing, budget and risk aversion, provided they've formulated a coherent trade plan.
Here’s just an example:
Trade Sample
- Entry: $1,850
- Stop-Loss: $1,880
- Risk: $30
- Target: $1,760
- Reward: $90
- Risk:Reward Ratio: 1:3
Author's Note: This is just a trade sample, not the analysis. Even if it is sound, it only weighs the evidence. We cannot tell the future. And the analysis might be wrong altogether. The objective of professional trading is to join statistics, and make money overall, not on an impossible-to-predict trade-by-trade basis.
Trading is nothing more than managing your luck. The more you're able to manage, the less you are exposed to the market’s randomness. Understand that trading is a business like any other, which requires education, experience and investment. Happy trading!
