-
US stocks end rally
-
Wal-Mart plunges on missed earnings expectations
-
Yields continue to attract funds away from stocks
-
Treasury oversupply threatens second equity selloff
-
Stronger dollar makes US equities more expensive, both for foreign and domestic investors
Key Events
US stocks ended a six-day rally on Tuesday, selling off on several fundamental events:
- Wal-Mart (NYSE:WMT) missed fourth-quarter earnings expectations, weighing on averages
- Rising bond yields pulled fund flows out of equities and
- A strengthening dollar boosts the cost of US stocks for foreign investors
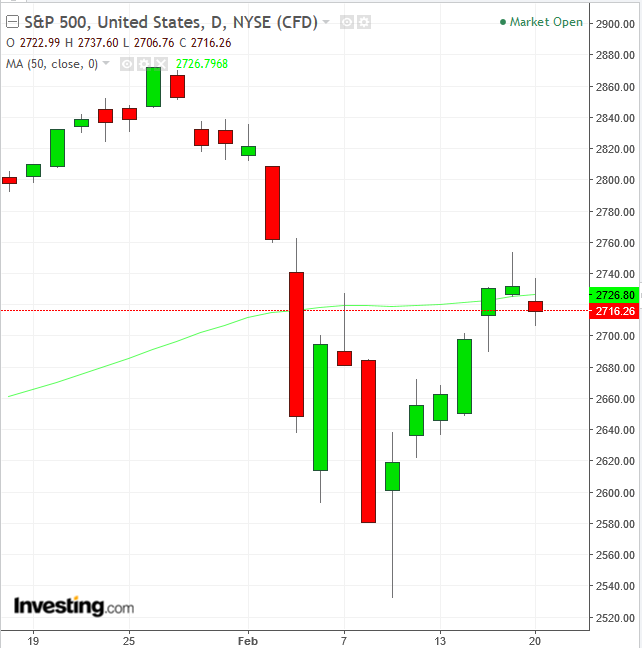
The S&P 500 Index lost 0.58 percent—confirming Monday’s bearish Shooting Star candlestick, falling below the 50 dma. The drop was led by a 2.27 percent plunge in Consumer Staples.
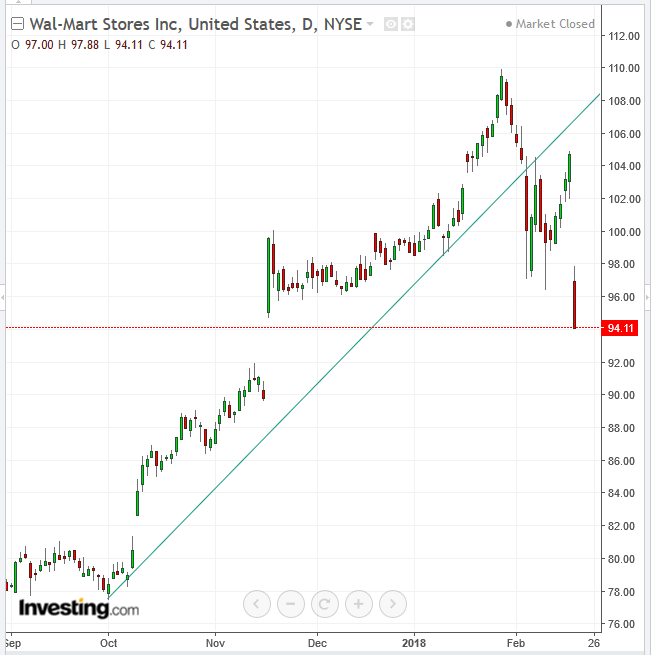
The sector took a hit when Wal-Mart slumped 10 percent, its worst performance in 30 years, as brick-and-mortar stores are losing market share to e-commerce companies, led by Amazon (NASDAQ:AMZN). Indeed, Technology was the only sector in the green yesterday, with a 0.09 percent gain.
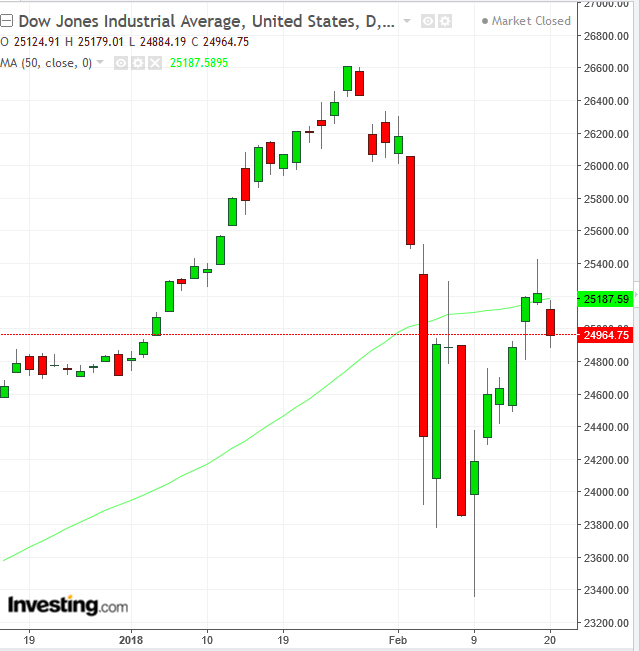
The Dow Jones Industrial Average dropped 0.98 percent. As with the S&P 500, the decline, below the 50 dma in this case, confirms the previous day’s shooting star.
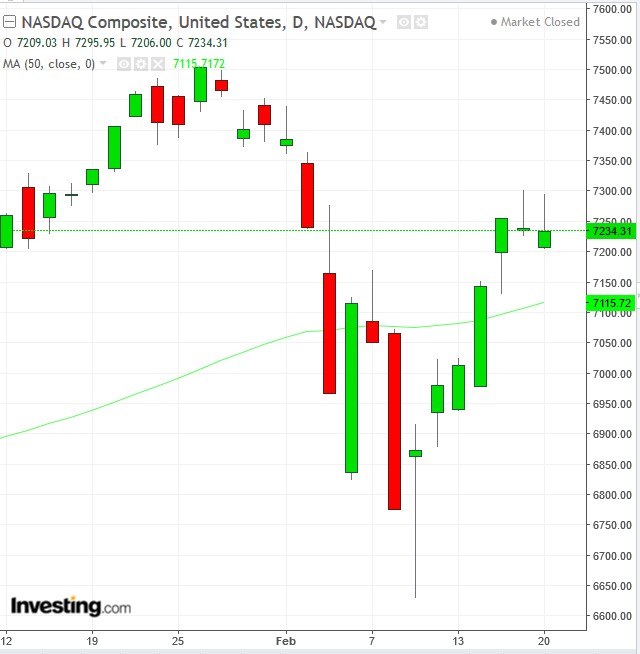
The NASDAQ Composite outperformed its peers, falling less than 0.1 percent. It is also staying safely above its 50 dma, by 1.65 percent.
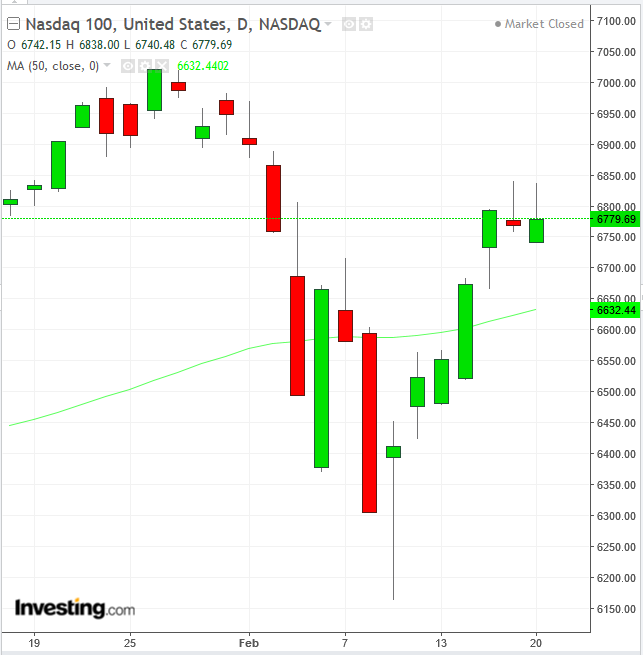
The NASDAQ 100 was boosted by chipmakers. The index climbed 0.15 percent, led by Qualcomm (NASDAQ:QCOM) which upped its bid for Dutch rival NXP Semiconductors (NASDAQ:NXPI).
It was a defensive move against a hostile $121 billion takeover attempt by Broadcom (NASDAQ:AVGO). The latter revealed it was considering a bid on Qualcomm as of November 3. The news at the time propelled Qualcomm shares higher by as much as 19 percent in New York, the company's biggest intraday share activity since October 2008, after Bloomberg broke the takeover story. QCOM closed 12.8 percent higher at the time.
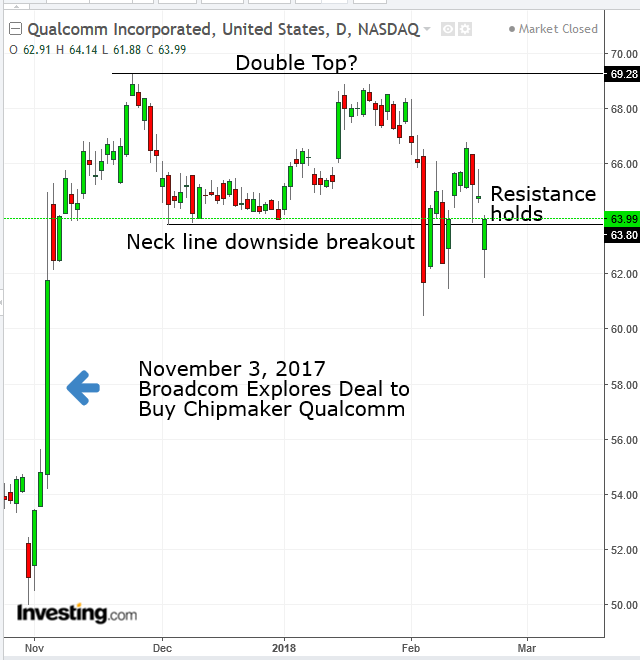
Yesterday, however, Qualcomm shares fell 3 percent, as investors who bought on hopes for the takeover by Broadcom, dumped the stock. Broadcom issued a statement criticizing Qualcomm for raising its offer for NXP and accused QCOM of transferring value from its own shareholders to those of NXP. Technically, the stock price completed a double top on February 5, with a 5-percent penetration. Yesterday’s rebound seems to have been blocked by the resistance of the neckline.
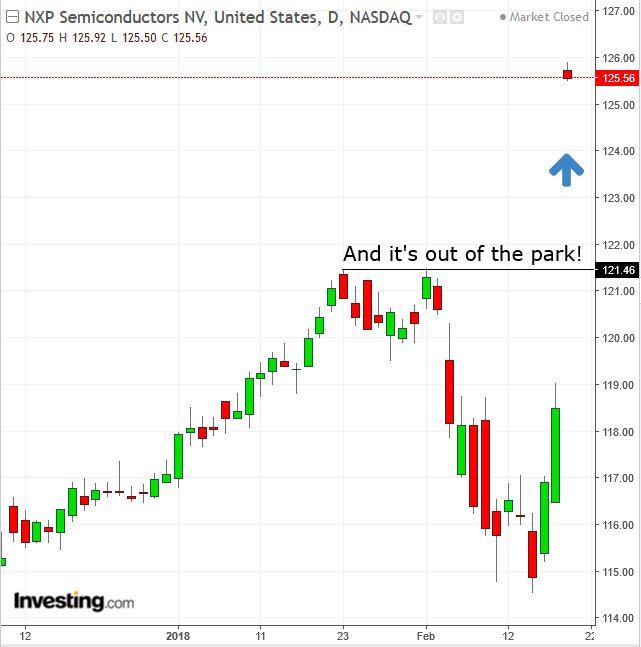
Sure enough, NXPI soared 6 percent, reaching an all-time high, against a falling market to boot.
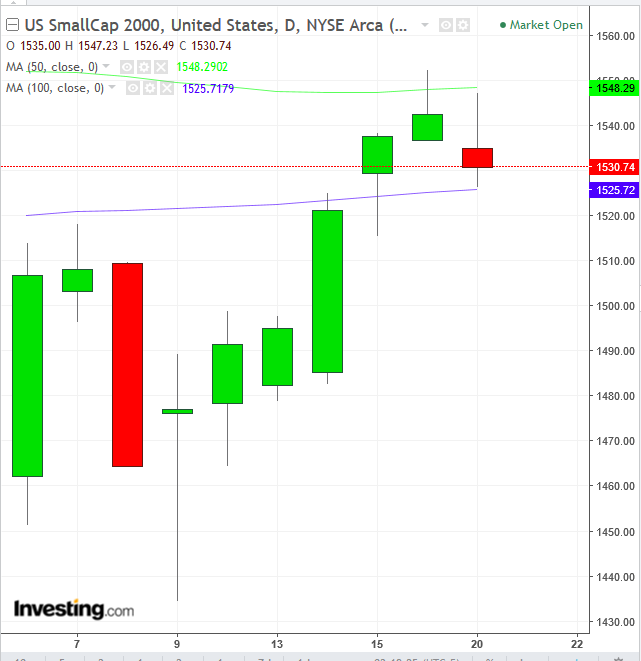
Meanwhile, the Russell 2000 dropped 0.75 percent. It underperformed its peers on a technical basis, since it nearly reached its 100 dma (blue). At the same time, the S&P 500 is 2.46 percent above its 100 dma, the Dow is 2.94 percent above its 100 dma and the NASDAQ Composite is 4.8 percent above its 100 dma.
Global Financial Affairs
This morning, European stocks retreated from yesterday’s gains, in what became a fourth-day range. The decline occurred despite gains during Asia trade.
Almost every sector of the STOXX Europe 600 Index fell, with the benchmark tracking losses seen on Tuesday during the US session rather than the more positive performance posted by Asian markets. Stocks listed on Hong Kong’s Hang Seng advanced, cementing a rebound from one of the worst equity sell-offs in years, which happened at the start of the month. S&P 500 Futures edged lower.
Meanwhile, yesterday's US Treasury auction sold $179 billion worth of securities, rebuilding its cash balance. The recent spike in yields caused the sharpest equity downturn in the last couple of years, as investors rotated out of risky stocks and into secure, high yielding bonds. Moreover, the spike in yields prompted by the Treasury selloff suggested that the Fed might speed up the pace of rate tightening, thus increasing the cost of borrowing, making it more difficult to support record equity prices.
Since the selloff, equity investors have generally been consolidating, a sign of adjustment to the new price level. Since for every sale there is a buy, and prices stopped falling, it’s assumed that new blood has come into current positions, ready to take on the burden of pushing prices back up. The consolidation suggests a cease fire between bears and bulls, which leaves the current price at equilibrium.
Yesterday’s oversupply of two-year Treasury notes and three- and six-month bills went off at rates unseen since 2008, while the 10-year rate was up to 2.89 percent. This deluge could push yields higher still, potentially repeating the recent stock rout. While speculators are turning bearish, money managers are looking at the highest Treasury bond yields in years as a buying opportunity, in a world where shorter-term Japanese and German notes still carry negative yields.
The outperforming US bond yields attract foreign demand, which requires investors to purchase the US dollar first.
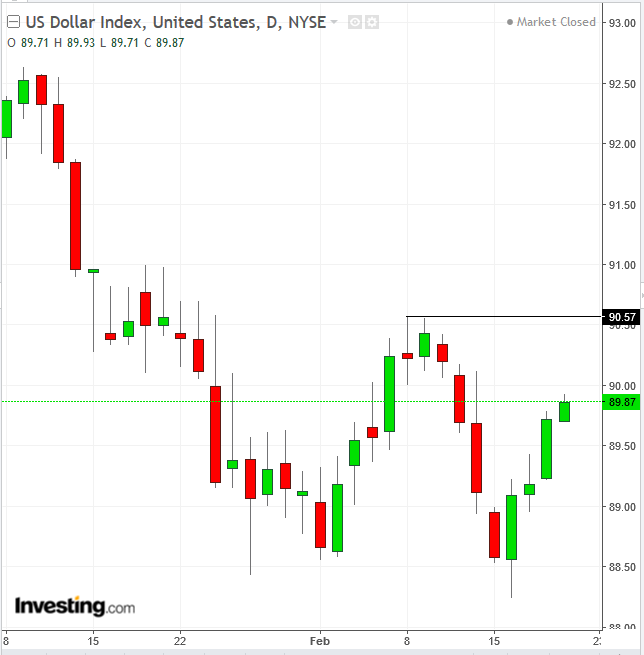
The dollar extended gains before another round of US debt sale and the release of minutes from the latest Fed meeting. Since the Treasury selloff is on the outlook of faster rate hikes, it attracts dollar demand.
The greenback climbed for a fourth consecutive day, to the highest level within its current push. It's also set for the highest close in almost three weeks, since February 2. Should the price overcome the 90.57 level, it may be said to have completed a small double-bottom.
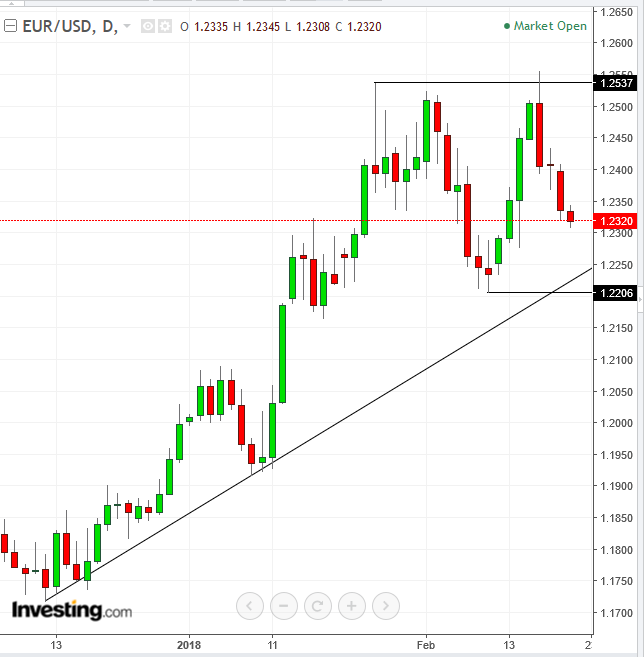
Naturally, a dollar bottom would almost certainly mean a top for its primary peer the euro. The single currency could potentially complete a double bottom, with a downside break below 1.2200. On Thursday, minutes from the most recent ECB meeting will also be released.
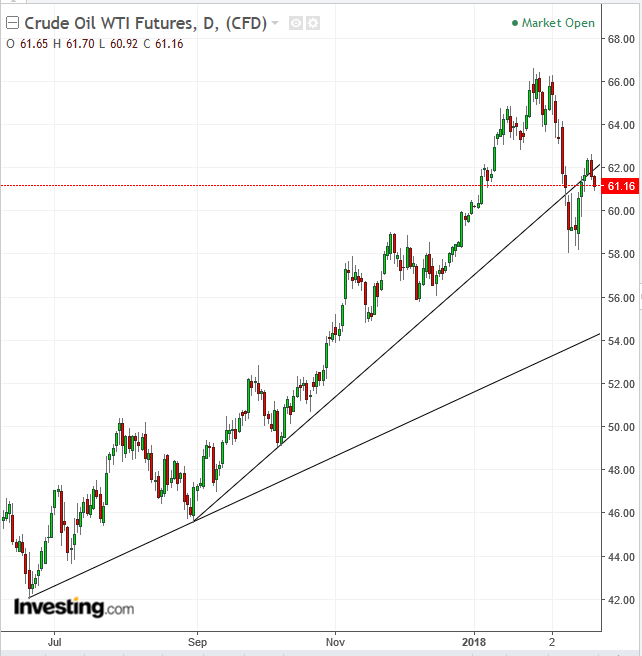
The stronger USD makes the dollar-denominated price of oil more expensive. Investors balanced the difference by pushing oil down toward $61 a barrel, ahead of US government data that is forecast to show crude inventories gained for a fourth week. Two key political risks on the horizon could also impact the price of oil going forward.
Technically, the price fell again below the uptrend line since August 31, opening the possibility of a decline to the flatter downtrend line since June 21.
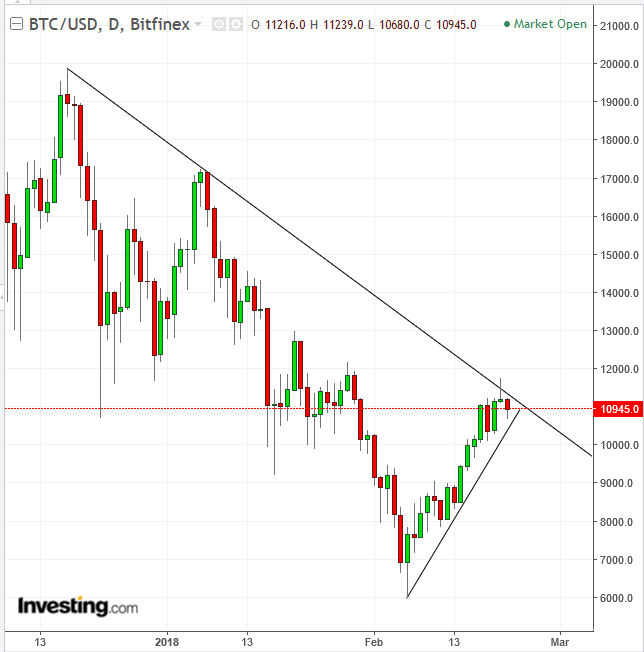
Bitcoin slipped below $11,000, confirming yesterday’s bearish Shooting Star, which attempted to cross above the downtrend line since December 17, the currency’s all-time high almost at $20,000. The battle now is between bulls drawing the uptrend line since February 6 and the $6,000 since December 17, drawn by bears.
Bitcoin as well as most other mainstream cryptocurrencies have had a tough 2018 so far. Still, not all digital coins have endured the wrath of sellers since the year began; some have been more resilient.
Up Ahead
-
Today the Federal Reserve will release minutes of its January 30-31 meeting, Janet Yellen’s final outing as chair, where officials kept interest rate unchanged.
-
Fed policy makers speaking this week include New York Fed President William Dudley and Atlanta Fed President Raphael Bostic. Cleveland Fed President Loretta Mester is among speakers at the US Monetary Policy Forum in New York City.
-
China's Shanghai Composite reopens on Thursday.
Market Moves
Stocks
-
The STOXX Europe 600 Index declined 0.3 percent as of 8:23 a.m. London time (5:23 EST).
-
Futures on the S&P 500 Index fell 0.1 percent, to the lowest point in a week.
-
The MSCI Asia Pacific Index increased 0.3 percent.
-
The UK FTSE 100 Index decreased 0.2 percent, to the lowest level in a week.
-
The MSCI Emerging Markets Index jumped 1 percent to the highest in more than two weeks.
Currencies
-
The dollar Index increased 0.15 percent, extending a rebound to a fourth day.
-
The euro decreased 0.1 percent to $1.2323, the weakest level in more than a week.
-
The British pound declined 0.2 percent to $1.3972, the weakest in more than a week.
-
The Japanese yen declined 0.3 percent to 107.66 per dollar, the weakest in more than a week.
-
South Africa’s rand jumped 0.2 percent to 11.7067 per dollar.
-
The MSCI Emerging Market Currency Index advanced less than 0.05 percent.
Bonds
-
The yield on 10-year Treasuries decreased less than one basis point to 2.89 percent.
-
Germany’s 10-year yield decreased three basis points to 0.71 percent.
-
Britain’s 10-year yield dipped three basis points to 1.559 percent, the lowest in two weeks.
Commodities
-
West Texas Intermediate crude decreased 1.1 percent to $61.13 a barrel, hitting the lowest in a week with the first retreat in more than a week.
-
Gold fell 0.1 percent to $1,327.88 an ounce, the weakest in more than a week.
