Opening Bell: Brent Posts Biggest Surge On Record; U.S. Futures Curb Early Tumble

Published 09/16/2019, 05:40 AM
Updated 09/02/2020, 02:05 AM
EUR/USD
-
GBP/USD
-
USD/JPY
-
XAU/USD
-
DJI
-
JP225
-
HK50
-
USD/CNY
-
DX
-
GC
-
ESH25
-
CL
-
1YMH25
-
NQH25
-
US10YT=X
-
SSEC
-
STOXX
-
MSCIEF
-
TIOc1
-

  • Brent crude trims down near-20% gain, the highest on record
  • U.S. futures, European shares's drop ease but markets remain on alert
  • Treasurys yields tumble, gold climbs on risk off

Key Events

Brent prices posted their biggest daily surge on record this morning, while broader markets shifted to risk off on heightened fears that flaring Mideast tensions and surging oil costs will weigh on a struggling global economy.

A concerted drone attack—claimed by Iran-backed Yemenite Houthi rebels—knocked out half of Saudi Arabia’s oil facilities on Saturday and 5% of the global supply after crippling the world's biggest crude oil processing plant.

U.S. Secretary of State Mike Pompeo characterized the attack as targeting the global oil supply. Pompeo also denounced Iran for pretending “to engage in diplomacy” and said the country will be "held accountable for its aggression." The U.S. administration released satellite images showing the attack would have been more easily carried out from either Iran or Iraq. President Donald Trump followed up with a tweet of his own, saying the U.S. is “locked and loaded depending on verification.”

Iran denied accusations, calling the U.S. deceitful and declaring it was ready for a “full-fledged war.”
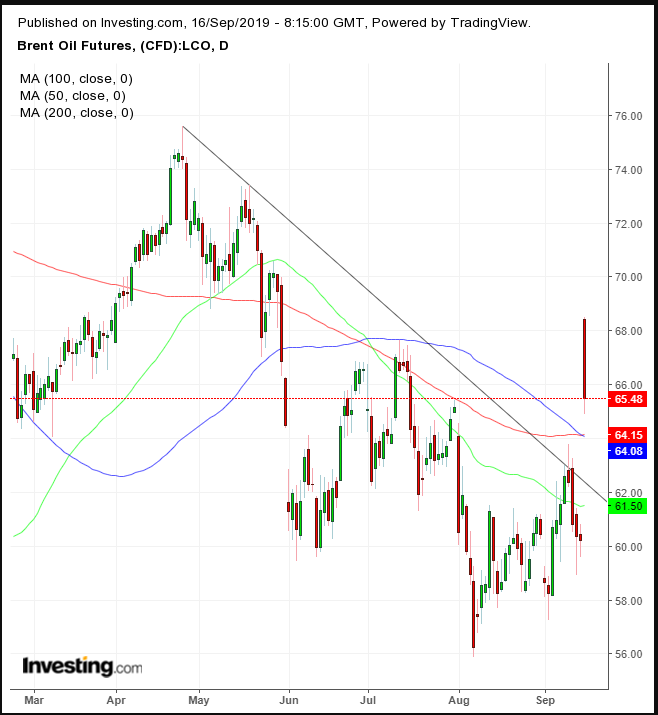
Brent Daily Chart

Brent futures jumped almost $12 at the open, or nearly 20%, the biggest price leap since 1988—when the global benchmark launched—after the largest supply-disruption shock ever.

Prices later pulled back to about 8% higher by late European morning, but were still heading for the biggest advance in almost three years. Technically, the price gapped above the downtrend line since April 25.
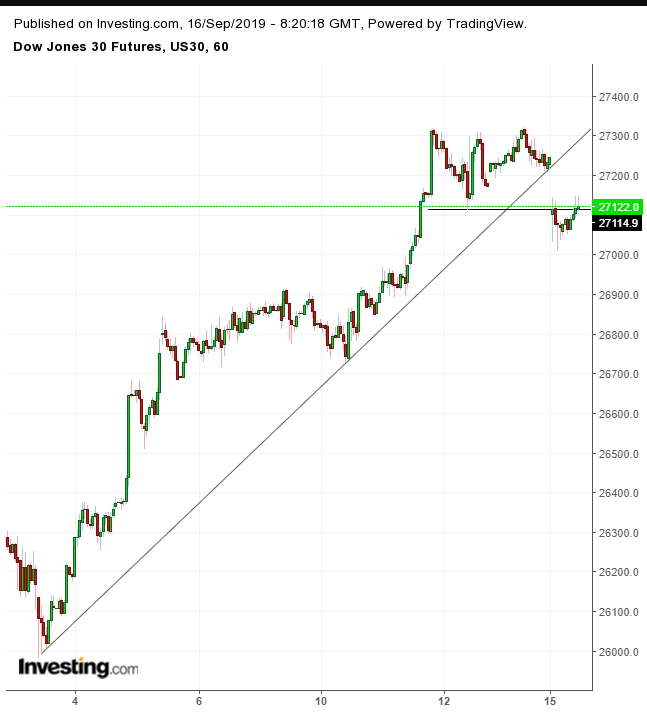
Dow Futures Hourly Chart

Global Financial Affairs

Meanwhile, futures on the S&P 500, Dow and NASDAQ 100 hovered in the red after partly trimming a deeper loss, with trading on Dow contracts suggesting a 150 point lower open for the underlying index.

From a technical perspective, the hourly price completed a double top and fell below its uptrend line since Sept. 3, and is now struggling to climb back above the neckline.

Europe's STOXX 600 halted a four-day advance following a mixed session in Asia.

Here, Japan’s Nikkei (+1.05%) outperformed. Hong Kong’s Hang Seng dropped 0.83% and China’s Shanghai Composite held relatively steady (-0.02%) after Chinese industrial production figures missed the monthly forecast, adding to signs the country’s economy is slowing down.
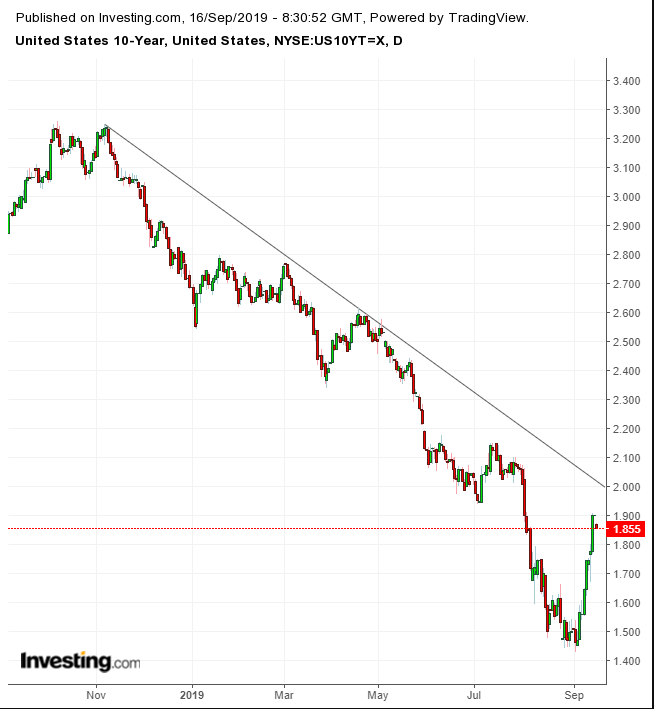
UST 10-Year Daily Chart

In the bond market, the yield on 10-year Treasurys took a dive, paring a 30% gain—to a six-week high—from the Sept. 3 bottom. From a technical standpoint, the slip was facilitated by the rate nearing the downtrend line resistance since November 2018.

The dollar recouped most of the day’s losses and the yen gave up much of its gains.
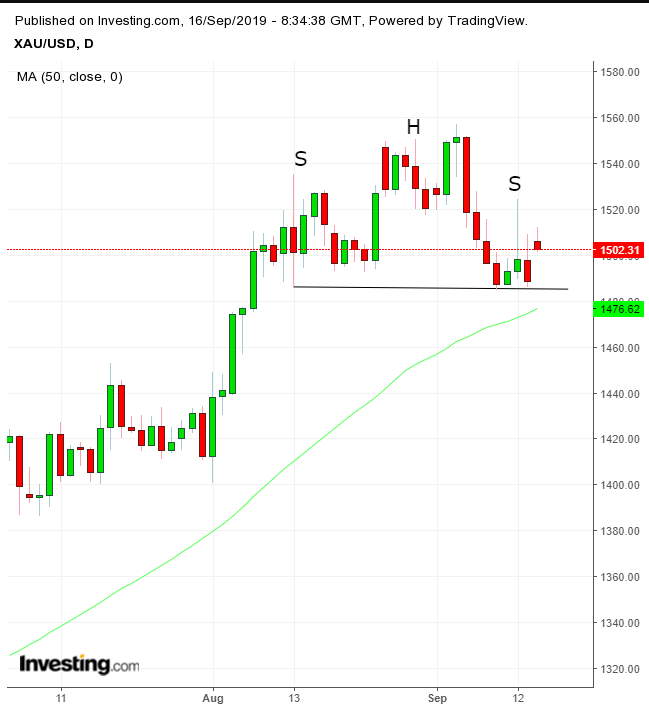
XAU/USD Daily Chart

Gold has been developing a small H&S top. While market turbulence is showing signs of easing, if geopolitical tensions increase, the yellow metal is likely to flip its market dynamics, propelling prices past the Sept. 4 high of $15,57.09, to extend the uptrend.

Up Ahead

  • The Federal Reserve is widely expected to lower U.S. interest rates in response to slowing global economic growth and muted inflation. Chairman Jerome Powell will hold a post-decision press conference on Wednesday.
  • The Bank of Japan monetary policy decision is on Thursday, followed by a briefing from Governor Haruhiko Kuroda.
  • Bank Indonesia and Bank of England also decide policy on Thursday.
  • Australia jobs figures are out on Thursday.
  • Quarterly expiration of futures and options on indexes and stocks on Friday could add to this week's key calendar events to boost volatility.
  • Market Moves

    Stocks

  • The Shanghai Composite Index was little changed.
  • The MSCI Emerging Market Index dropped 0.3%.
  • Currencies

  • The Dollar Index was little changed.
  • The euro was little changed at $1.1071.
  • The British pound fell 0.4% to $1.2457.
  • The onshore yuan gained 0.1% to 7.073 per dollar.
  • The Japanese yen climbed 0.2% to 107.91 per dollar.
  • Commodities

  • West Texas Intermediate crude surged 7.9% to $59.18 a barrel.
  • Iron ore sank 2.2% to $94.10 per metric ton.
  • Gold climbed 1% to $1,503.67 an ounce.
  • Latest comments

    Loading next article…
    Risk Disclosure: Trading in financial instruments and/or cryptocurrencies involves high risks including the risk of losing some, or all, of your investment amount, and may not be suitable for all investors. Prices of cryptocurrencies are extremely volatile and may be affected by external factors such as financial, regulatory or political events. Trading on margin increases the financial risks.
    Before deciding to trade in financial instrument or cryptocurrencies you should be fully informed of the risks and costs associated with trading the financial markets, carefully consider your investment objectives, level of experience, and risk appetite, and seek professional advice where needed.
    Fusion Media would like to remind you that the data contained in this website is not necessarily real-time nor accurate. The data and prices on the website are not necessarily provided by any market or exchange, but may be provided by market makers, and so prices may not be accurate and may differ from the actual price at any given market, meaning prices are indicative and not appropriate for trading purposes. Fusion Media and any provider of the data contained in this website will not accept liability for any loss or damage as a result of your trading, or your reliance on the information contained within this website.
    It is prohibited to use, store, reproduce, display, modify, transmit or distribute the data contained in this website without the explicit prior written permission of Fusion Media and/or the data provider. All intellectual property rights are reserved by the providers and/or the exchange providing the data contained in this website.
    Fusion Media may be compensated by the advertisers that appear on the website, based on your interaction with the advertisements or advertisers.
    © 2007-2025 - Fusion Media Limited. All Rights Reserved.