by Pinchas Cohen
Global Financial Affairs
Investors this week proved that even a negative can be transformed into a positive, at least insofar as market gains and multiple all-time highs are concerned:
- Saturday: North Korea did not fire another intercontinental nuclear missile as expected on its “foundation day.”
- Sunday: Hurricane Irma didn't cause as much damage as feared
- Monday: Trump and the opposition party Democrats reached a debt-ceiling deal (albeit temporary)
- Wednesday: Democratic party leaders aka the opposition dine with Trump, discuss a variety of issues including DACA, tax bill, infrastructure
- Wednesday: Republicans promise new tax framework in 2 weeks even though nothing yet exists
Market-Risk Dissipates
As the week progressed, investors came out of hiding, and developed an appetite for profit after multiple risks faded into the background—at least for now—spurring stock indices to back-to-back fresh records and the dollar to its sharpest rally since March.
Renewed Potential for Tax Reform
President Donald Trump had dinner Wednesday with Senate Minority Leader Chuck Schumer and House Minority Leader Nancy Pelosi. On Sunday, we noted that the potential trigger for a market sell-off could be the debt-ceiling deal reached between Trump and the Democrats, if investors realize the deal could reduce the possibility of a tax overhaul bill, having weakened Republicans and strengthened Democrats.
However, perhaps the President’s dinner with 'Nancy and Chuck,' suggests the debt-ceiling extension deal was part of a secret plan for a tax bill. What is known right now is that Trump and the Republicans have promised a new tax framework in two weeks.
Is That You, Inflation? Long Time No See!
Investors assessed the latest inflation readings for clues on the Fed's next policy moves. The latest releases are heating up, as higher gasoline prices post-Hurricane Harvey boost US producer inflation.
While economists say this uptick is unlikely to allay Fed concerns about ongoing flat-to-depressed inflation, Thursday’s Consumer Price Index (CPI) data announcement for the month of August may confirm a new uptrend for inflation.
While investors are anticipating higher inflation, spurred by the impact of hurricanes Harvey and Irma—expected to boost prices for oil and gas, as well as from the expense of rebuilding—the Bureau of Labor Statistic’s CPI read will predate the hurricanes’ impact. If the report shows that inflation already climbed before the hurricane double whammy, it would demonstrate a trend, one that will be even sharper when the impact of the hurricanes kicks in.
On the one hand, this will imbue investors with confidence in the economy; on the other hand, it will increase the probability of a Fed hike in December, which would renew faith in the US economy – a positive for bond yields and the dollar – but raise the cost of borrowing which would be a negative for stocks over the long-term, since share prices have been propped up by the availability of cheap money.
The question is, how long would it take equity traders to become aware of the implications that ending semi-free money will have on stock prices? Since the Brexit vote they seem to have developed a narrow market view.
New U.S. Highs
All three US major indices registered new, fresh record highs yesterday. It was the third straight gain for both the S&P 500 and NASDAQ Composite and the fourth day of a winning streak for the Dow Jones Industrial Average. For the SPX it was also the third straight record close; the second straight for the the Dow and NASDAQ.
From a technical perspective, equities are due a correction upon reaching points of resistance, formed by an expected increase in selling, which could be the case shortly for each of these indices.
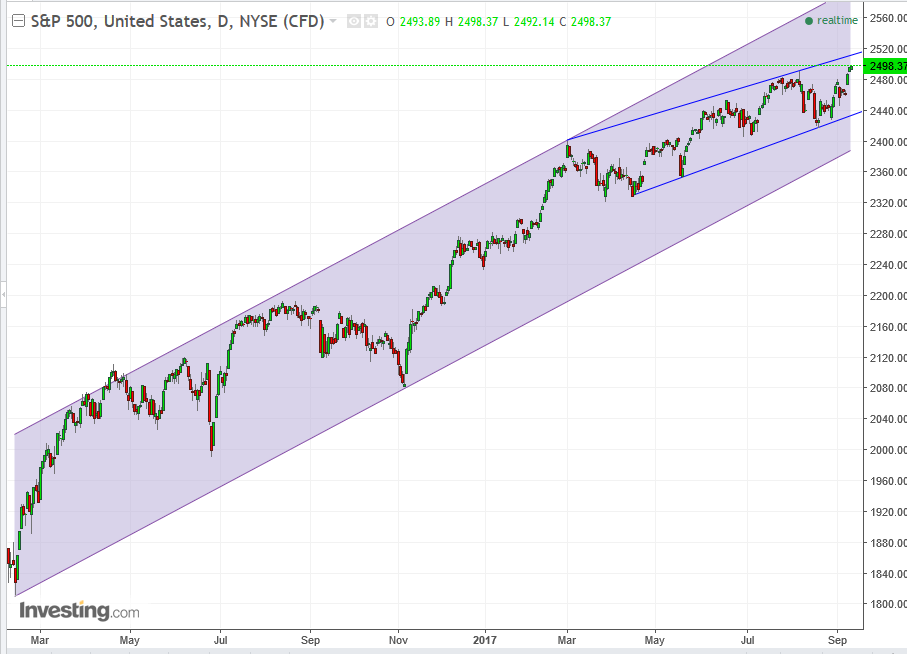
The S&P 500 Index has been trading within a rising channel since February 2016. Since March of this year it has been trading within a rising channel with a more gradual incline, heading toward the bottom of the steeper channel since February 2016. The price has neared the top of the slower channel, which means it’s due for a correction in the narrower channel, within a correction within the broader channel.
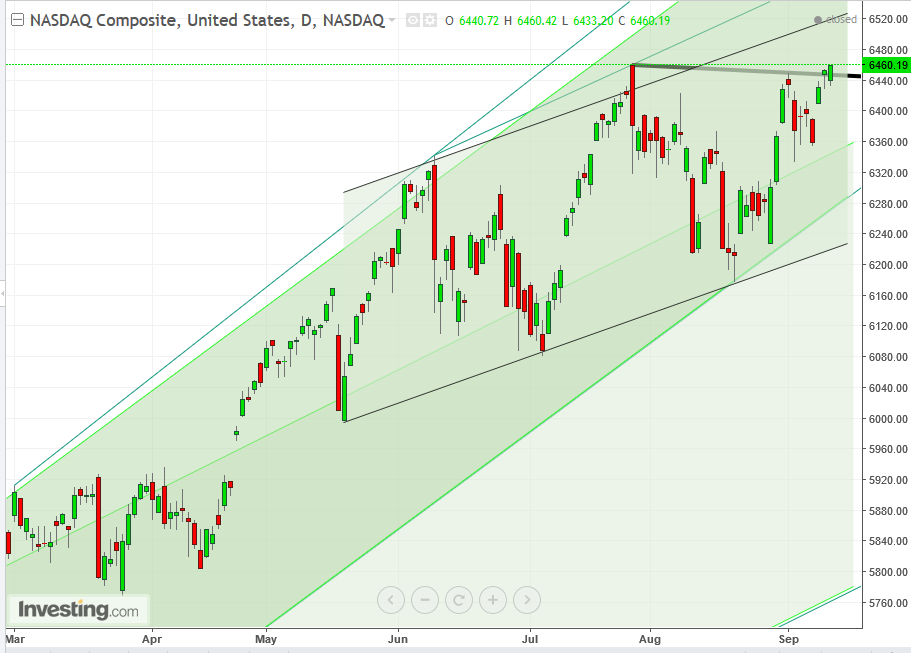
After the NASDAQ Composite's February 2016 uptrend accelerated in November, the price decelerated to a slower rise in June, moving against the original trend, perhaps toward the channel bottom, even if at a higher price. While it reached the channel-bottom on August 21 and confirmed the integrity of the trend with a rebound, it failed to rally above the previous, July 27 peak, even if it registered two higher, negligible closes. Unless it manages to surpass the 6,500.00-key level, it is likely to correct to the 6,300.00 May channel.
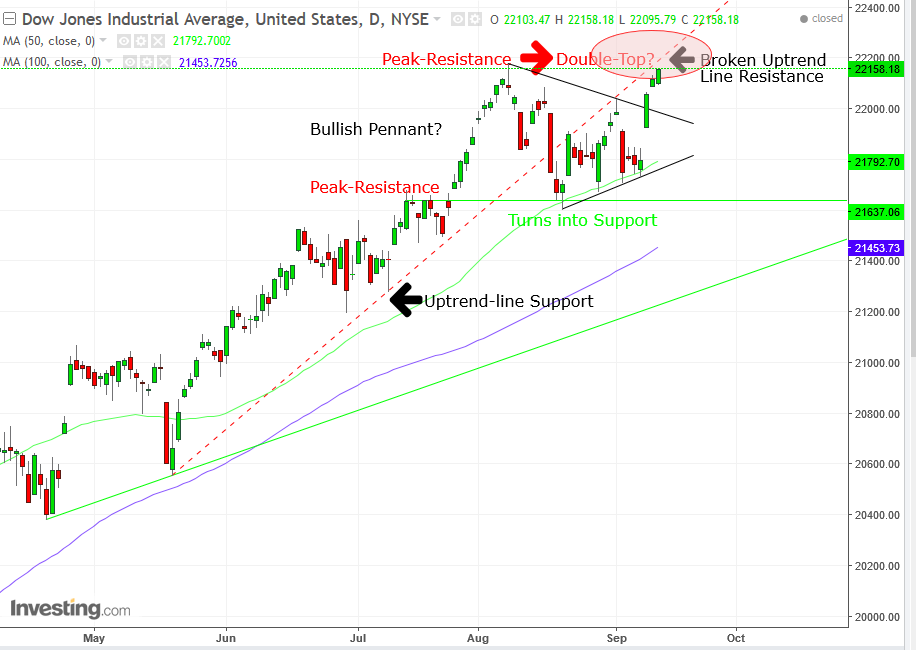
While the Dow, the country's oldest index and the one that includes the US's larges companies, demonstrates that investor sentiment stands on the edge of a knife and can go either way, the chart also highlights the conflict more starkly.
The average crossed below its May 18 uptrend line, then failed to cross back above it, as well as above the former August 8 peak. Traders developed a symmetrical triangle, as they pulled the price back and forth in an ever-narrowing price range, till it broke upside, suggesting a continuation of the trend prior to its interruption.
Though a symmetrical triangle suggests continuity, it rarely forms at market tops. Therefore, while the compounded resistance of the broken uptrend line and former peak meet at 22.170 (red oval), suggesting pressure on the price, the completed pennant suggests a 22,500 target-price target. Either way, return-moves are common after breakouts, which test the integrity of the pattern. Should it rebound, it would suggest continuation; should it fall below the pinnacle, it would suggest a correction back toward the earlier, April uptrend line (green).
Since technical analysis quantifies supply and demand, different market-structure phenomena would meet at the focal points, revealing where on the price map traders are hiding. That was demonstrated in the resistance of both the violated uptrend line (dotted red) and the former peak meeting. As well, it can be seen with the 100 dma (blue) rising together with the April uptrend line (green) and the 50 dma (green) tracing the uptrend line and forming the triangle’s bottom. This is how we see the bulls and the bears draw their lines in the sand, as things come together.
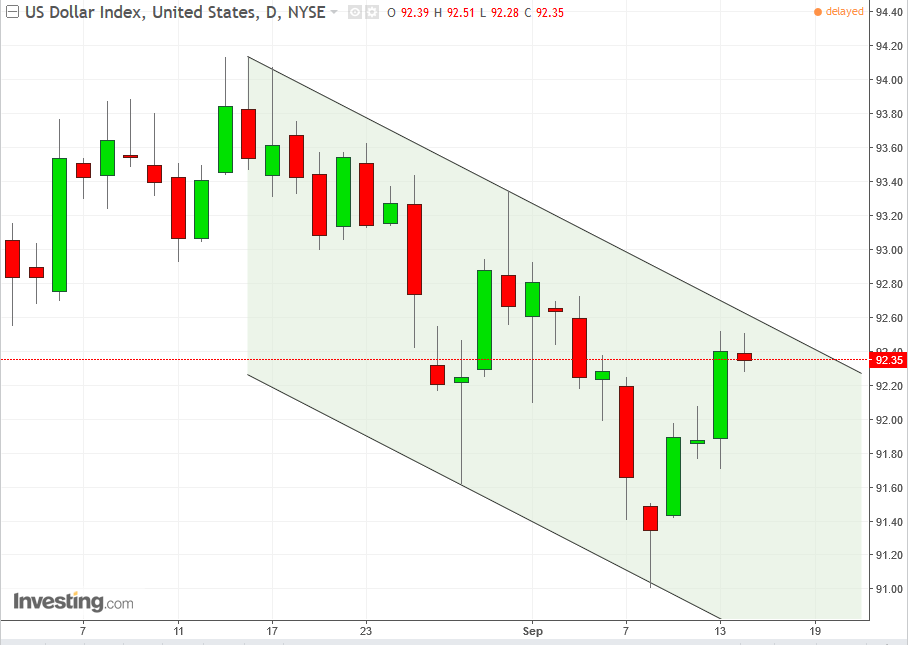
The dollar too is facing resistance on what is considered a correction within a downtrend.
While it may appear that equities and safe havens such as gold and the Japanese yen are in conflict, as both are in uptrends, equities are post-rally and thus due for a correct whereas havens are post-correction and thus due to extend their rally.
Today's Sessions: Asia and Europe
As discussed yesterday Asian and European stocks have stalled, as benchmarks fluctuated throughout the Asia-Pacific session, after the S&P 500 scratched out a third-straight fresh record, within a fourth-straight gain.
Fundamentally that's because early morning releases out of China are signaling that the nation's economy is slowing down. Chinese retail sales, industrial production and fixed-asset investments all lagged last month, after a lackluster July, as efforts to rein in credit expansion and reduce excess capacity in the world’s second-largest economy hit home. Investors are now expecting lowered Chinese demand for commodities, especially base metals, which is weighing down mining stocks and commodity prices. As well, the North Korean threat rears its ugly head yet again, as Pyongyang threatened to use nuclear weapons to “sink” Japan and turn the US “into ashes and darkness” over added sanctions.
Up Ahead
- While the BOE is expected to stand pat, its dilemma over how to cope with rising inflation and stagnant wages will be on full view today in London.
- The highlight for the U.S. session will be the consumer price data.
Market Moves
Stocks
- The TOPIX fell 0.3 percent at the close in Tokyo.
- Australia’s S&P/ASX 200 Index lost 0.1 percent and South Korea’s KOSPI added 0.7 percent.
- The Hang Seng in Hong Kong slipped 0.4 percent. Benchmarks in China, including the Shanghai Composite, also declined.
- The MSCI Asia Pacific Index fell 0.1 percent.
- The Stoxx Europe 600 decreased 0.1 percent as of 8:33 London time (3:33 EDT).
- The MSCI All-Country World Index dipped 0.1 percent.
- The U.K.’s FTSE 100 slipped 0.2 percent to its lowest in more than a week.
- The MSCI Emerging Markets Index advanced 0.1 percent.
- S&P 500 Futures declined 0.1 percent.
Currencies
- The Dollar Index fell 0.1 percent.
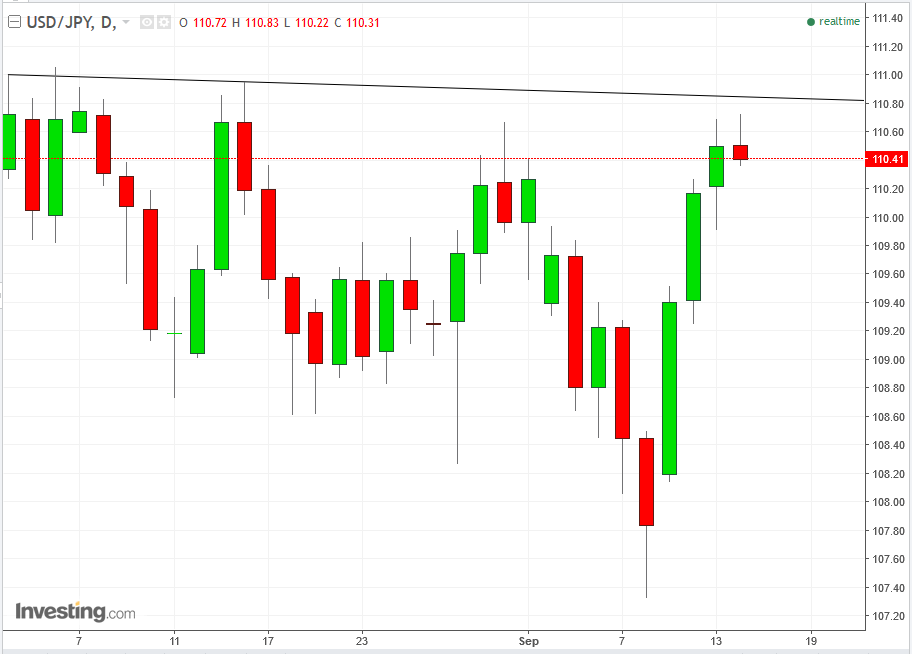
- Japan's yen was little changed at 110.46 per dollar after slipping 0.3 percent on Wednesday.
- The euro advanced 0.1 percent to $1.1898.
- The British pound increased 0.1 percent to $1.3222.
- The Aussie jumped as high as 80.16 U.S. cents after the jobs data release before pulling back when the China numbers were announced.
Bonds
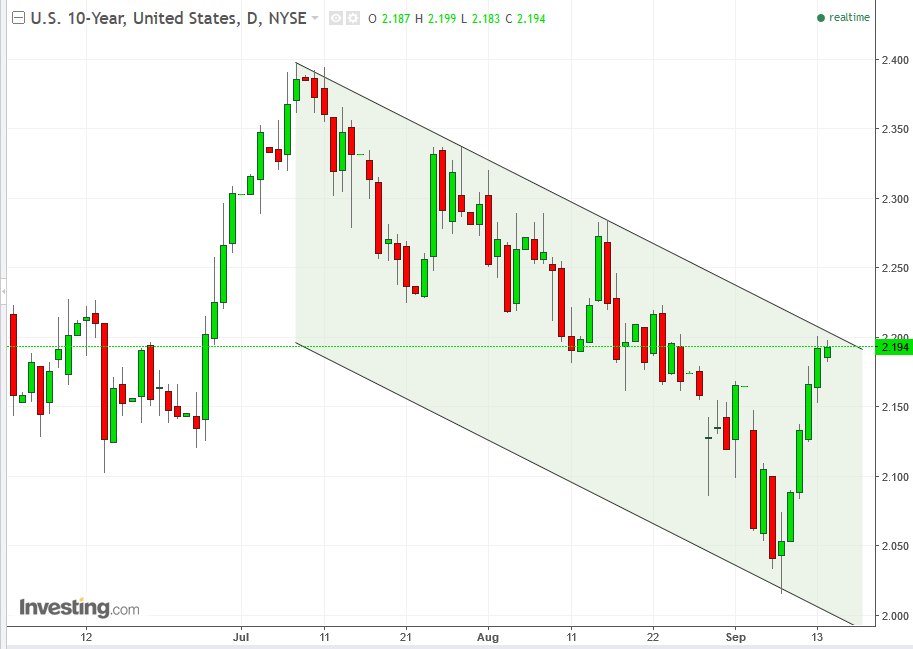
- The yield on 10-year Treasuries rose less than one basis point to 2.19 percent, hitting the highest in three weeks.
- Germany’s 10-year yield rose one basis point to 0.41 percent, reaching the highest in almost four weeks.
- Britain’s 10-year yield rose two basis points to 1.164 percent, the highest in almost six weeks.
Commodities
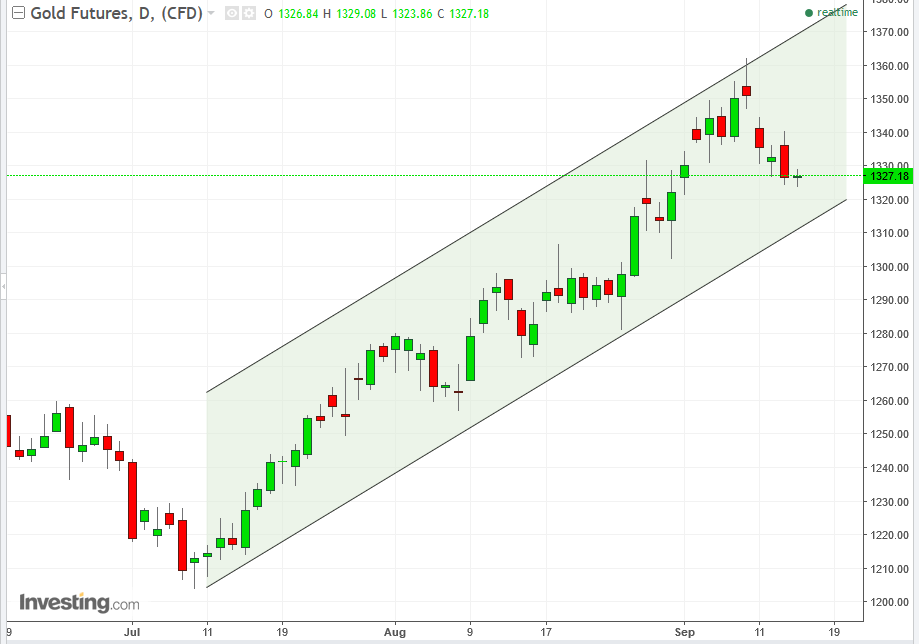
- Gold gained less than 0.05 percent to $1,323.84 an ounce.
- West Texas Intermediate crude increased less than 0.05 percent to $49.32 a barrel, the highest in five weeks.
- Copper fell 0.8 percent to $2.96 a pound, the lowest in a month.
Which stock should you buy in your very next trade?
AI computing powers are changing the stock market. Investing.com's ProPicks AI includes 6 winning stock portfolios chosen by our advanced AI. In 2024 alone, ProPicks AI identified 2 stocks that surged over 150%, 4 additional stocks that leaped over 30%, and 3 more that climbed over 25%. Which stock will be the next to soar?
Unlock ProPicks AI