- Investors shed stocks, flee to safe-havens amid lack of trade deal details
- Dollar weakens despite risk-off shift
- 3 /5-year Treasury yield curve inverts for the first time in ten years
- Oil extends bounce on OPEC+ supply cuts hopes, technically only a correction
- Pound stages intraday rebound
- US financial markets are set to close on Wednesday for a national day of mourning to honor former President George H.W. Bush.
- Federal Reserve Chairman Jerome Powell’s testimony to Congress, scheduled for Wednesday, has been canceled.
- China's November trade balance is due on Saturday.
- The Bloomberg Dollar Spot Index fell 0.2 percent.
- The euro gained 0.2 percent to $1.1342.
- The yield on benchmark 10-year Treasuries fell less than one basis point to 2.98 percent. The 3-year note yield increased four basis points to 2.84 percent as the yield on the 5-year note rose two basis points to 2.83 percent.
- Germany’s 10-year yield fell less than one basis point to 0.31 percent.
- West Texas Intermediate crude jumped 4.4 percent to $53.19 a barrel.
- Gold rose. 0.7 percent at $1,230.62 an ounce, after reaching the highest level in a month.
- LME copper climbed 1.6 percent to $6,295 per metric ton, after reaching the highest level in almost 10 weeks on the biggest increase in a month.
Key Events
Global stocks slipped lower alongside futures on the S&P 500, Dow and NASDAQ 100 this morning, as investors' initial euphoria around the weekend's US-China trade breakthrough met with the complex reality of the world’s two largest economies finding a formula that both sides could live with. US Treasurys, gold and the yen jumped as investors back-pedaled into safe-haven assets, while the dollar missed out on the risk-off wave and edged lower.
The STOXX Europe 600 retreated from yesterday’s gains, though, technically, losses were muted relative to Asian counterparts. The decline of the pan-European benchmark is confirming yesterday’s shooting star, when the index gave up most of its intraday gains. The bearish candle stick increases the likelihood of the benchmark’s H&S continuation pattern, bearish after the near-10 percent decline between late September and late October.
In the earlier Asian session, Japan’s Nikkei (-2.39%) led the regional slide, erasing all of yesterday’s gains amid a lack of details around the much publicized US-China tariff deal. Furthermore, the Chinese government failed to reciprocate US President Donald Trump’s upbeat tweets with an equally positive statement around a prospective deal—something that must have not sit well with investors who bought into the deal following the G20 summit.
The explanation, by various unnamed Chinese officials, that President Xi Jinping had not yet returned from his trip and was therefore unable to comment on the key breakthrough is weak at best. Unless, of course, he doesn’t consider the 90-day tariff pause a breakthrough. We have recently suggested that the onus is on bulls and that US equities are weak. We also provided a contrarian trade to short the Dow from its premarket height.
Global Financial Affairs
Yesterday, global shares jumped on the prospect of a forthcoming trade deal, as well as on last week’s robust gains. The S&P 500 climbed 1.09 percent, extending last week’s rally—the biggest in nearly seven years. Energy (+2.22%) outperformed, tracking the near 4-percent jump in WTI crude, with Technology (+2.21) following close behind. Health Care (-0.48%) was the only sector closing in red territory.
The Dow Jones Industrial Average rallied 1.13 percent and the NASDAQ composite outperformed its peers, gaining 1.51 percent.
Meanwhile, the Russell 2000 lagged as the only major index to fall short of a full percentage point gain (0.89%)
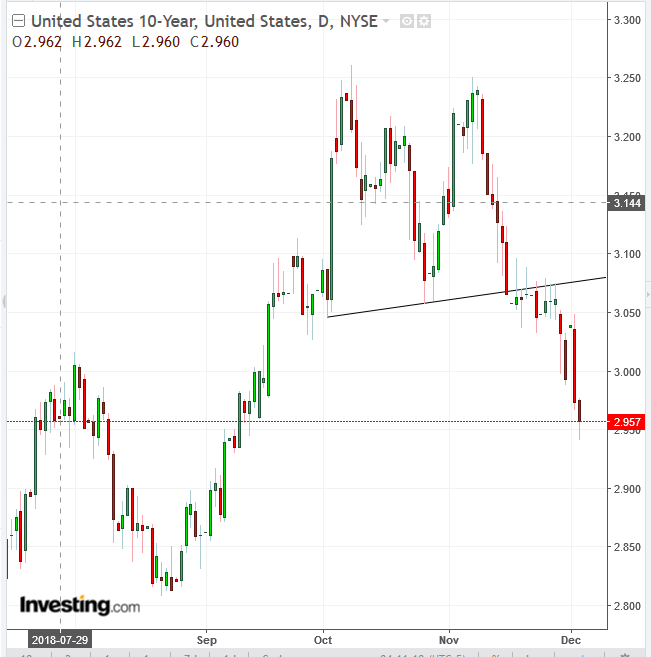
The yield on 10-year Treasurys deepened the penetration to the downside breakout of a double-top reversal, below the 3 percent psychological level to 2.95 percent, as investors rotated once again out of equities and into safe-havens. Last week, we warned that the double-top is a bearish signal to equities.
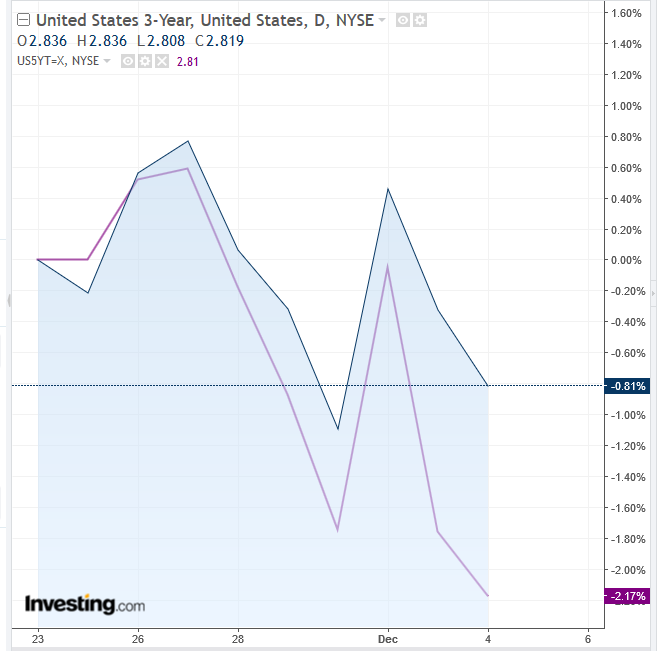
But the US yield curve posted another, even more ominous indicator as its 3-5-year portion inverted for the first time in more than a decade. The difference between 3-year and 5-year Treasury yields dropped below zero. A yield inversion is one of the most proven indicators of an upcoming recession and is closely watched by savvy market participants due to its far-reaching implications for the broader financial market—even when a recession doesn’t take place.
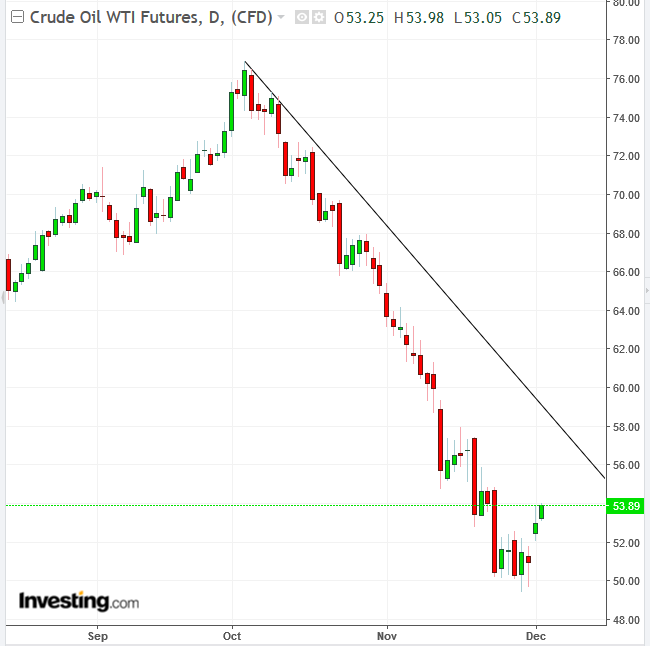
Oil continued to surge on a positive outlook for supply cuts, as Saudi Arabia and Russia extended their OPEC+ deal into 2019 and Canada’s largest producing province ordered unprecedented supply cuts. Technically, although the price has bounced more than 9 percent since Thursday’s low price, it should be considered nothing more than an upward correction within a downtrend, until it proves otherwise. The first evidence of a bona fide reversal would be when the price scales above the downtrend line since Oct. 3, at the $55 level.
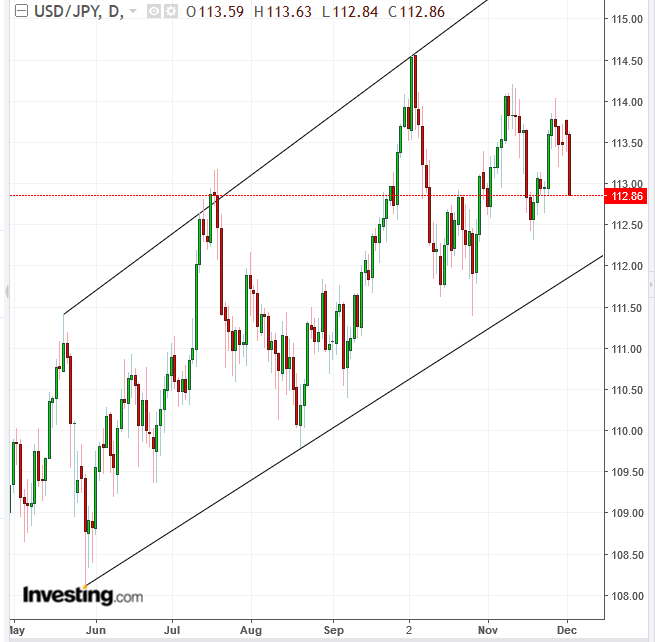
The yen leaped forward, pushing the dollar below 13,000 and reclaiming, at least for today, its top safe-haven currency status. Technically, it is just a downward corrective move toward the bottom of its ascending channel since June.
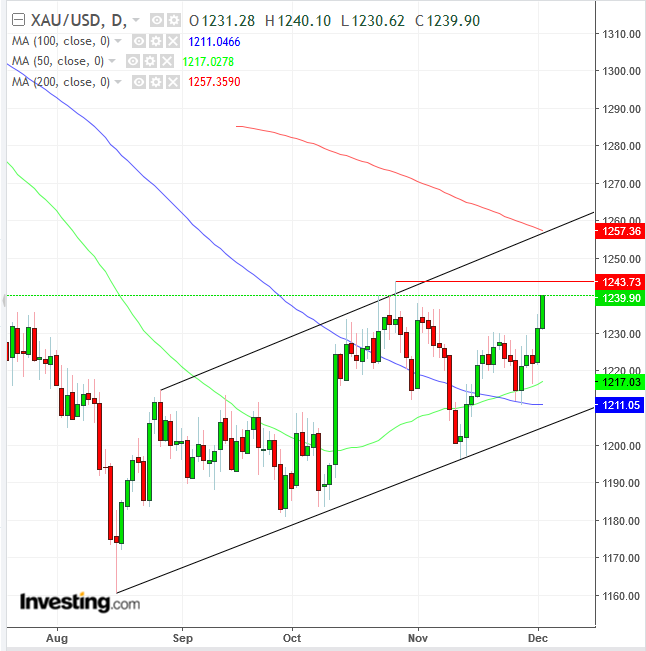
Gold has finally staged a comeback, though it is unclear whether it was mainly thanks to its safe-haven status or to dollar weakness. It has reached the highest level since mid-July. Technically, it needs to overcome the 1,243.73 level, the Oct. 26 peak, to extend the uptrend within the ascending channel since mid-August.
Copper also rallied, as did most other commodities.
Elsewhere, the pound experienced some strong volatility, recovering from earlier losses that had been driven by mounting fears over a no-confidence vote against UK Prime Minister Theresa May's government. News reports that the UK could effectively hold the clout to revoke Article 50—which triggered proceedings for the country's exit from the EU—propped the sterling higher in the late European morning session, helped by stronger-than-expected manufacturing PMI data.
China yuan climbed with emerging market assets.
Up Ahead
Market Moves
Currencies
Bonds
Commodities
