- China shares fall to almost four-year low, deepening bear market
- Futures slide, US yields target fresh 7-year high after Fed minutes
- European shares buck the trend on upbeat corporate results
- US Small Caps performance could signal potential market top
Key Events
Asian stocks and futures on the S&P 500, Dow and NASDAQ 100 slipped lower on Thursday after minutes from the Fed's latest monetary policy meeting confirmed the central bank's goal to continue down the path to higher rates into next year.
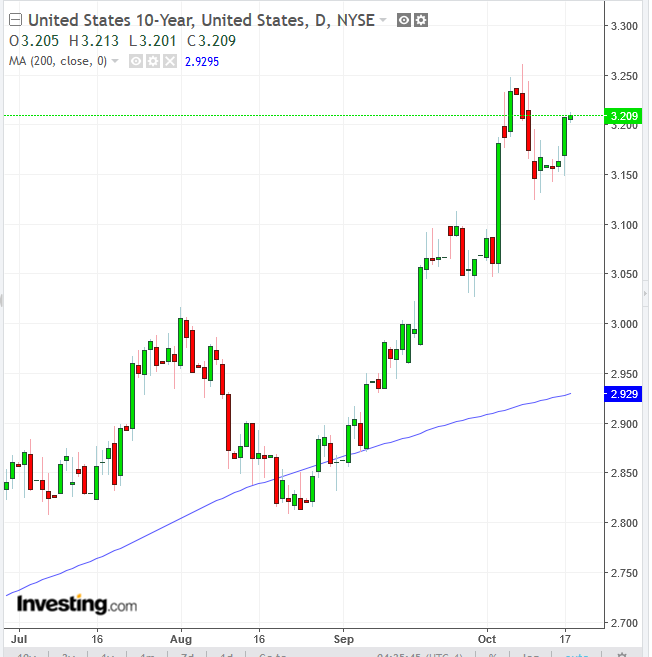
The yield on 10-year Treasurys ticked toward seven-years highs, climbing past 3.2 and targeting the 3.261 high posted October 9, as the FOMC minutes also suggested that policymakers are keen to keep raising rates above the level they consider neutral for the economy—meaning they could literally tighten the economy.
Meanwhile, dollar eased slightly after hitting one-and-a-half week highs on the Fed release, but remained supported.
The STOXX Europe 600 bucked the downward equity trend thanks to positive corporate results, extending a rebound from the 22-month low it hit last week on fears of rising borrowing costs from soaring US bond yields and ongoing geopolitical risks. French supermarket operator Carrefour (PA:CARR) was the top gainer in early trading, up 7.5 percent as the company reported that sales acceleration in France and Brazil overshadowed weakness in Southern Europe. From a sector perspective, telecoms were the best performers, with Sweden's Tele2 (ST:TEL2b) lifting its guidance after better-than-expected earnings results.
During the earlier Asian session, China's Shanghai Composite underperformed, loosing 2.94 percent, after the Trump Administration intensified its trade offensive against China on Wednesday by threatening to withdraw from a 144-year old treaty, signed by 129 nations, that gives Chinese companies discounted shipping rates for small packages sent to American consumers. The mainland index fell to a fresh low of almost four years, extending its bear market.
In comparison, Hong Kong's Hang Seng performed exceedingly well, giving up only 0.03 percent. Japan’s Nikkei 225 lost 0.8 percent. South Korea’s KOSPI dropped 0.89 percent. Australia’s S&P/ASX 200 (+0.06 percent) outperformed and was the only major index in the region to close in positive territory.
Global Financial Affairs
Yesterday, most US stocks edged lower amid mixed earnings reports and resurfacing interest rates worries. The S&P 500 retreated 0.03 percent. It rebounded from an earlier 0.95 percent loss. Industrials (-0.73 percent) and Materials (-0.64 percent) weighed most heavily on the benchmark, hit by concerns of an escalation of US-China tensions. Financials (+1.01 percent) helped the benchmark avert a more substantial loss, as rising interest rates are seen to raise banks' profits.
The Dow Jones Industrial Average slipped 0.36 percent, dragged down by IBM's (NYSE:IBM) disappointing revenue results. The company’s stock tumbled more than 7 percent to a 19-month low, the most in four years, after it reported $18.76 billion revenues, falling short of the $19.10 billion expectations.
The NASDAQ Composite edged 0.04 percent lower, as trade tariff headwinds were offset by Netflix's (NASDAQ:NFLX) 5.28 percent stock surge, after the streaming entertainment company added 9.4 million global subscribers. Some analysts, however, argue that Netflix won’t be able to sustain this growth on a global scale.
Technically, yesterday's gain was only a little more than half the 9.25 percent higher open: the slide from the opening price may confirm a supply deficiency we warned about.
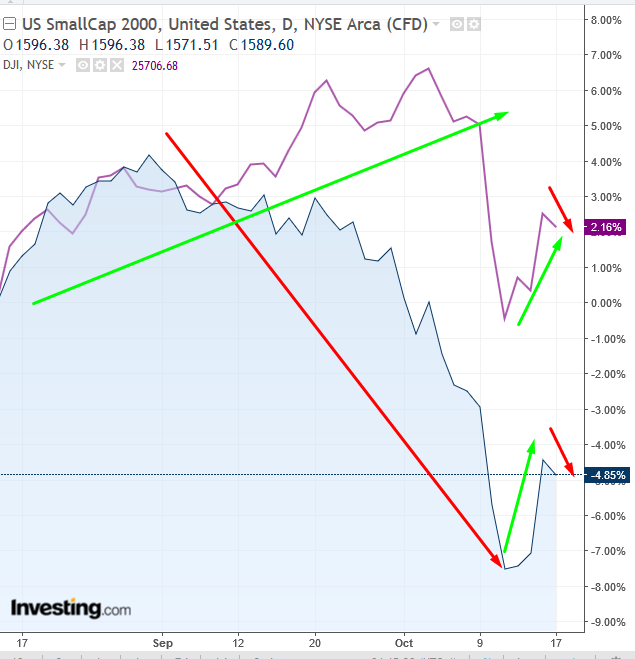
The Russell 2000 underperformed, dropping 0.45 percent. We find it noteworthy that both small caps and mega caps are underperforming the S&P 500 and the NASDAQ, after the Dow Jones and the Russell have been generally maintaining a negative divergence since March, due to the trade war. Investors bought small caps when the outlook for tariffs increased and rotated back into mega caps when the trade headwind subsided.
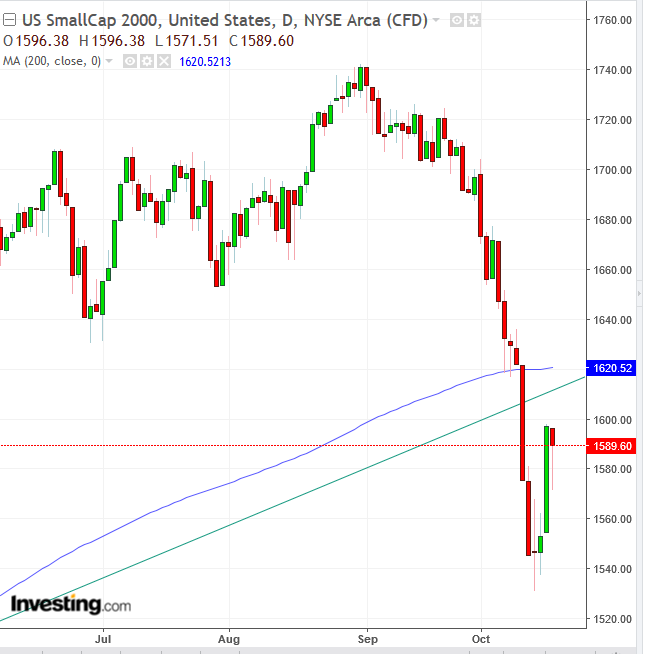
Is it because the SEC made it easier for small firms to hide financial information that might affect the value of the company? Though that's not yet clear, investors must keep a close eye on the Russell 2000. It's a leading indicator for a market top since it;s typically the first major US index to signal that, and the only one to have already fallen below its uptrend line since the February 2016 bottom as well as its 200 DMA.
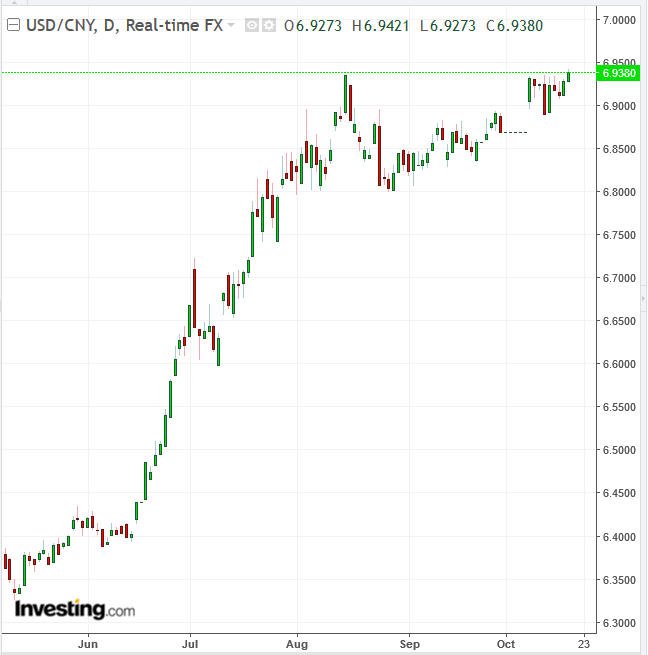
In FX markets, the yuan slid to the lowest since January 2017 as the US Treasury abandoned plans to single out China as a currency manipulator while at the same time heightening its scrutiny on the Asian country’s exchange-rate policy.
The pound rebounded from a decline over the ongoing Brexit deadlock and is currently on the rise.
Most metals traded lower in London after being hurt by a strengthening dollar and Chinese economic growth concerns.
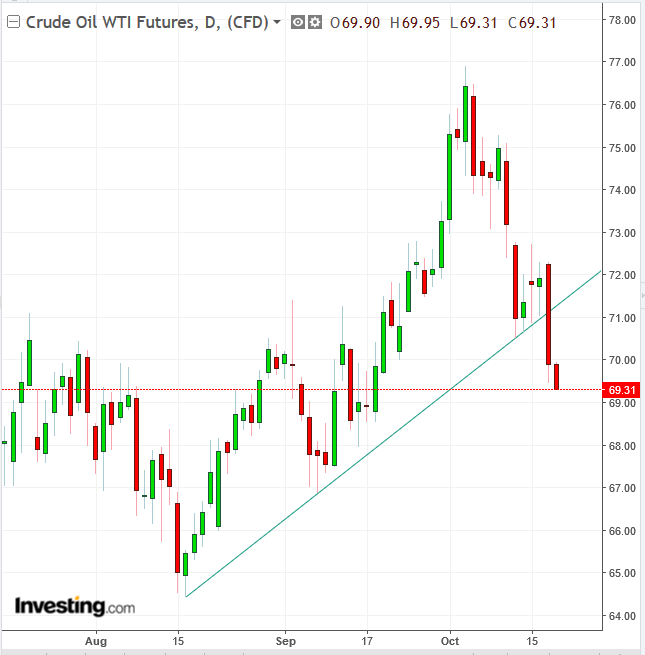
Oil extended a decline below $70.00, after falling below its uptrend line since mid-August. Yesterday, the price fell 3 percent to below $70 after a significant rise in US crude stockpiles. Meanwhile, some positive supply data could help ease the recent WTI price volatility.
Up Ahead
- China third-quarter GDP is released on Friday, in addition to last month’s retail sales and factory output.
Market Moves
Stocks
- The STOXX Europe 600 gained 0.4 percent.
- Futures on the S&P 500 dropped 0.3 percent.
- The UK’s FTSE 100 climbed 0.1 percent to the highest level in more than a week.
- Germany’s DAX ticked 0.5 percent higher.
- The MSCI Emerging Market Index gave up 0.7 percent.
- The MSCI Asia Pacific Index fell 0.7 percent.
Currencies
- The Dollar Index decreased 0.07, giving up earlier gains and forming an intraday shooting star.
- The euro climbed less than 0.05 percent to $1.1506.
- The British pound declined 0.1 percent to $1.3102, the weakest level in more than a week.
- The Japanese yen gained less than 0.05 percent to 112.64 per dollar.
Bonds
- The yield on 10-year Treasuries dropped less than one basis point to 3.20 percent.
- Germany's 10-year yield gained one basis point to 0.47 percent, the most significant advance in more than a week.
- Britain’s 10-year yield ticked two basis points higher to 1.591 percent, the first advance in more than a week.
- Italy’s 10-year yield climbed one basis point to 3.557 percent.
Commodities
- West Texas Intermediate crude edged 0.2 percent lower to $69.59 a barrel, the lowest level in a month.
- Gold fell 0.1 percent to $1,221.09 an ounce.
