European shares fall a full percent
Asian benchmarks slip but pare earlier losses, suggesting traders remain hopeful
Metals plunge
Today’s volatility in contrast to yesterday's bullish US session
Key Events
Global stocks, Treasury yields and industrial metals took a hit this morning after US President Donald Trump's administration yesterday threatened to slap additional tariffs on as much as $200B worth of Chinese goods, re-igniting investor fears of a full-fledged trade war. The latest levies would affect a broad array of consumer goods including tuna, salmon, dog leashes, tires and luggage.
Asian markets and the Chinese yuan bore the brunt of the widespread flight to safety, which abruptly halted the global equity rally of the last few days. Futures on the S&P 500, Dow and NASDAQ 100 are all sliding lower, confirming the abrupt shift to risk-off trading.
Still, despite the increased likelihood of added volatility, we believe the broader US uptrend will remain intact given the diverging pattern between US and Chinese shares since the trade dispute began. While China's Shanghai Composite entered a bear market and the renminbi remains in a downtrend, US indices are in a bull market, trading close to their record highs. If investors are able to hang on for the next few weeks, in order to see if earnings meet their high expectations, we could yet see US benchmarks hit new record highs.
The pan-European STOXX 600 Index slumped a full percent this morning, ending a six-day straight rally, with all sectors in the red. Shares of companies most reliant on overseas markets for growth took the brunt of the losses. Basic resources plunged 2.6 percent and car makers dropped 1.5 percent.
Japan’s TOPIX slumped over 1.5 percent initially, but rebounded during the second hour, trimming the setback by nearly half, to 0.8 percent, though still ending a three-day advance. China’s Shanghai Composite pared an initial 2.65 percent plunge to 1.8 percent. Unlike the TOPIX, which trended higher with the rebound, the Chinese benchmark ranged.

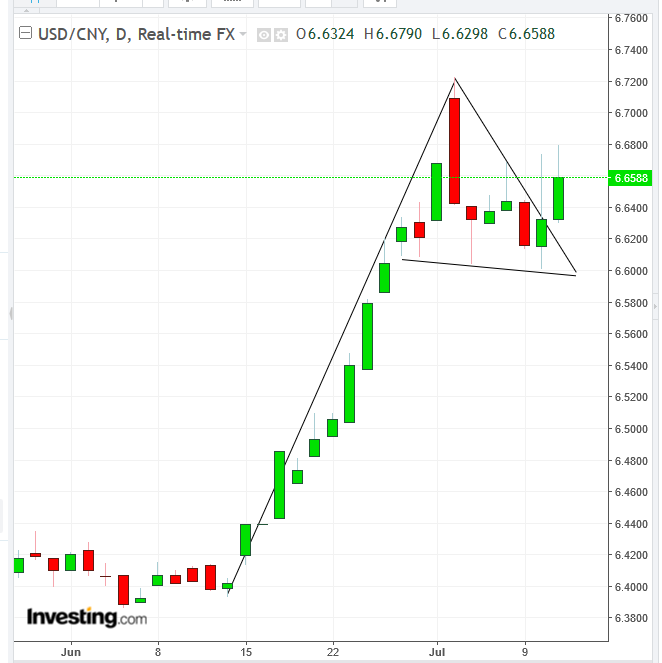
Along with regional indices, the Chinese yuan also fell, losing 0.4 percent after trimming an initial 0.7 drop. This is the second day of the currency's selloff, for an aggregated 0.66 percent loss. Technically, the USD/CNY pair provided an upside breakout to a bullish pennant pattern.
Hong Kong’s Hang Seng trimmed a 2.4 percent collapse to a 1.55 percent loss, finding demand at the 28,000 level, a support since October 2017. South Korea’s KOSPI initially slid 1.35 percent but it too trimmed losses, to 1.6 percent.
Australia’s S&P/ASX 200 declined almost 0.7 percent, extending Tuesday’s fall to an overall 1.10 percent setback. Technically, this is considered a correction within an uptrend, a return-move to Friday’s upside breakout of a bullish pennant. The mechanics that make up a return move following a breakout—where traders who are long take profits and short are squeezed—may explain why the Australian gauge, which has lately been rising even as Asian market peers were selling off, was the only benchmark to fall without any rebound.
Global Financial Affairs
The return of trade war jitters generated a rush back to the security of Treasurys. Yields on the 10-year note dropped a full percentage point. However, the safe haven yen weakened against the dollar, as there is no BoJ tightening in sight.
Today’s risk-off mood follows yesterday's exuberant US session, in which equities rose to their highest in almost a month, with additional technical milestones achieved.

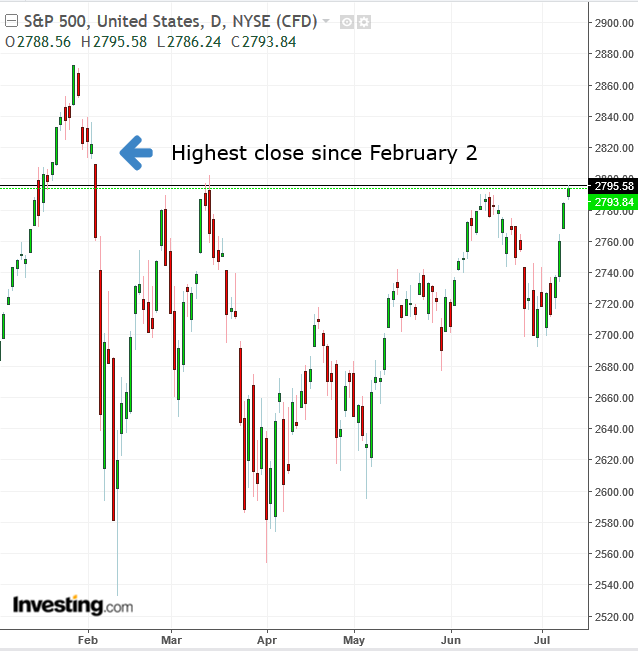
The S&P 500 gained 0.35 percent, hitting its highest close since February 2. However, the two sectors that outperformed were growth oriented, Consumer Staples (+1.19 percent) and Utilities (+0.95 percent), signaling that traders are managing their fears even as they bid up prices. Yesterday's trading overcame the preceding, mid-June peak, at 2791.47, confirming an uptrend since April 3, just 3.8 percent from the benchmark's record high.
The Dow Jones Industrial Average rose 0.6 percent, for a fourth straight day, with an aggregate advance of 3.1 percent, to its highest level in 3 weeks. The NASDAQ Composite added less than 0.05 percent of value, after paring back from a 0.2 percent higher open. Still, it was the fourth daily advance for the tech heavy index, which closed just 0.6 percent below its all-time high.
Perhaps the most reliable sign that traders are ready to put aside their trade concerns was the underperformance of the Russell 2000. The small cap index, whose listed companies have a domestic focus, bucked the trend, falling 0.53 percent, ending five-day advance. This trimmed an aggregate gain of 3.8 percent to 3.2 percent, albeit after registering an all-time intraday high.
The slide that followed could indicate a double-top in the making, with the 50 DMA "guarding" the neckline. As well, the RSI provided a negative divergence.

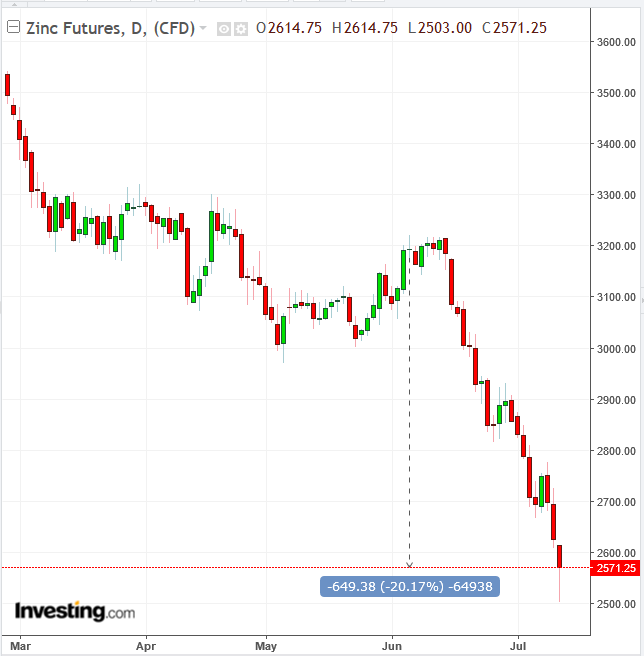
Metals have borne the brunt of today's flight to safety on added trade fears, with copper, nickel and zinc all sinking. Oil dropped below $74 a barrel in New York, even as an industry report was said to show shrinking U.S. crude stockpiles. Nevertheless, seven regional events are likely to drive the price of oil higher in the longer term.
Up Ahead
Earnings season begins with JPMorgan Chase & Co (NYSE:JPM). and Citigroup Inc (NYSE:C) reporting results on Friday.
The most noteworthy US data may be the June inflation report on Thursday. Consensus expects it will show both headline and core growth picking up. There’s another deluge of Treasury debt sales too, with a total $156 billion of notes and bills offered.
Chinese trade data due at the start of the next week will probably show slightly slower export growth after early indicators pointed to softer overseas demand and weaker export orders, Bloomberg Economics said.
Market Moves
Stocks
Futures on the S&P 500 were down 0.8 percent after dropping as much as 1.1 percent earlier.
The Stoxx Europe 600 Index retreated 0.8 percent.
The U.K.’s FTSE 100 declined 0.9 percent.
Japan’s TOPIX dropped 0.8 percent.
Hong Kong’s Hang Seng fell 1.6 percent and the Shanghai Composite lost 1.8 percent.
South Korea’s KOSPI dropped 0.6 percent.
Currencies
The Dollar Index is flat.
The Japanese yen was flat at 111 per dollar, compared with 111.27 before the tariff report came out.
The offshore yuan fell 0.4 percent to 6.67 per dollar.
The euro edged 0.1 percent lower to $1.1729.
Bonds
The yield on 10-year Treasuries slipped about one basis point to 2.84 percent.
Commodities
West Texas Intermediate crude slid 0.4 percent to $73.81 a barrel.
Gold lost 0.3 percent to $1,251.88 an ounce.
Which stock should you buy in your very next trade?
AI computing powers are changing the stock market. Investing.com's ProPicks AI includes 6 winning stock portfolios chosen by our advanced AI. In 2024 alone, ProPicks AI identified 2 stocks that surged over 150%, 4 additional stocks that leaped over 30%, and 3 more that climbed over 25%. Which stock will be the next to soar?
Unlock ProPicks AI