- US futures, European shares dragged lower by global risk-off trade
-
Asian markets plunge on negative economic data
-
Japan’ TOPIX drops the most in three months
-
China’s Shanghai Composite on track for its worst year since 2011
-
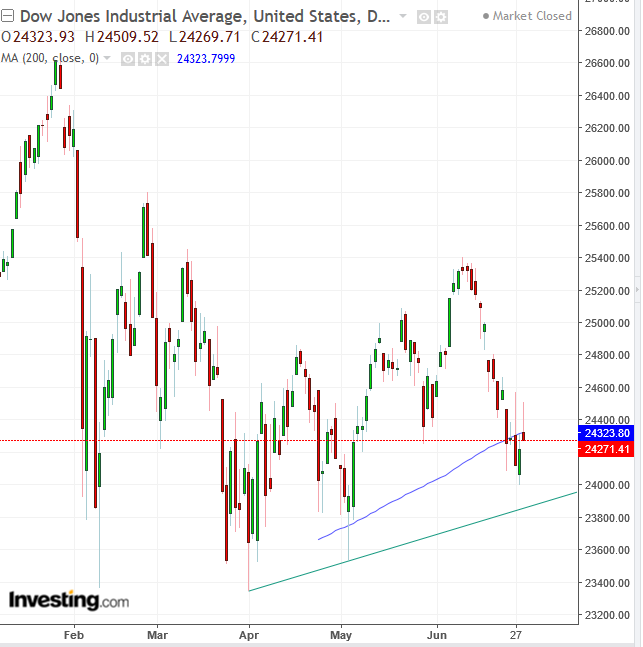
Dow Jones closes in the green but slides below 200 DMA
-
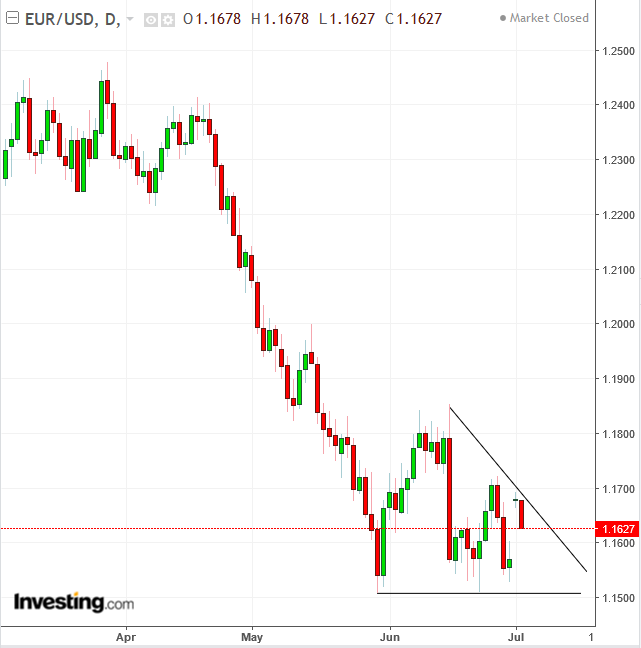
Euro falls on Germany’s coalition government deadlock, possible interior minister resignation
- Pound under pressure ahead of key cabinet Brexit talks
-
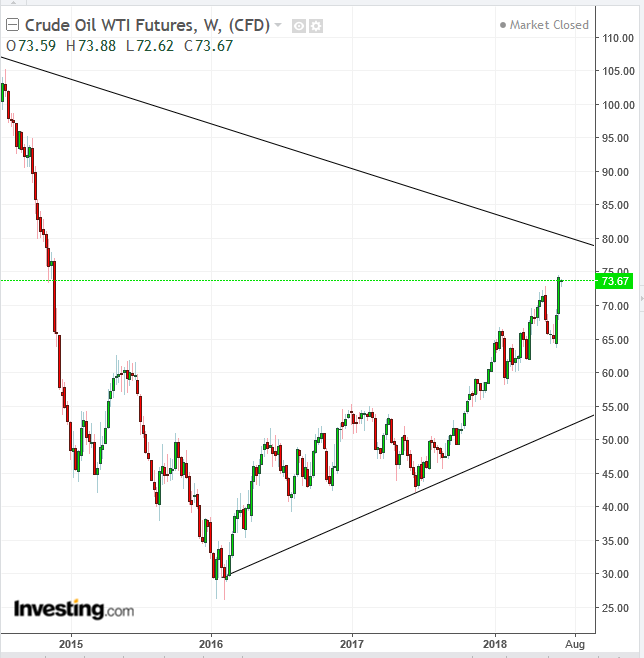
Oil slips below $74, after Trump calls for higher production
Key Events
Global stocks started off the new quarter on the back foot, as European shares and US futures on the S&P 500, Dow and NASDAQ 100 followed Asian stocks lower on Monday.
In FX markets, political uncertainty hit both the pound and the euro, just as the STOXX Europe 600 kept sliding lower—to 0.9 percent in the red at the time of writing—mostly dragged down by miners and energy producers stocks.
The dollar, conversely, continued to strengthen as a safe-haven amid growing trade-war headwinds, thereby weighing on emerging market currencies.
Earlier, in Asian trade, Japan's TOPIX plunged over 2 percent and closed at the bottom of the session, in the biggest slide in more than three months. Investors sold off after the The Bank of Japan's Tankan quarterly report showed that confidence among large manufacturers retreated in June, in a critical signal that worries around global trade have already filtered through to key parts of the economy.
China’s Shanghai Composite plummeted 2.5 percent, after a private gauge, the Caixin China manufacturing purchasing managers' index, fell to 51.0 in June, down from 51.1 in May. While a reading above 50 is still considered an expansionary indicator, the drop provides further evidence that the world's second-largest economy is, effectively, contracting. The Chinese mainland index is now on track for its worst year since 2011.
Hong Kong's Hang Seng was spared from the regional selloff, as it is remained closed for a holiday. South Korea's KOSPI tumbled 2.4 percent. Down under, Australia’s S&P/ASX 200 fared as the regional outperformer, losing only 0.25 percent.
Global Financial Affairs
Today’s risk-off trading follows a US session that ended the second quarter on a relatively positive tone. Although the S&P 500 eked out a paltry 0.08 percent gain, it still managed to improve from the heavier losses seen over the previous sessions. Moreover, looking at the bigger picture, the SPX sealed a third straight month of gains.

The Dow Jones gained 0.25 percent, a respectable result considering the wider global stock performance. More importantly, the large-cap industrial benchmark index has found support on the uptrend line since April 2, revealing that even export-reliant stocks, more exposed to the downsides of an international trade war, managed to attract demand at the height of the US-China tariff tit-for-tat. However, the index found resistance by the 200 DMA, which "forced" it to close beneath it. This is a relevant technical marker for many technical and non-technical traders.

Over in Europe, the single currency came under pressure after political tension within Germany’s coalition government deepened late on Sunday. Two of the main parties in the coalition—Merkel's Christian Democrats Union and interior minister Horst Seehofer's Christian Social Union—have increasingly clashed over the European migration crisis, with Seehofer signaling yesterday that he would resign after rejecting the EU deal brokered by Merkel in Brussels on Friday.
Meanwhile, sterling also edged lower—though it found its footing at around 4:00 EDT—as UK Prime Minister Theresa May prepares to discuss a third proposal on post-Brexit customs rules with her cabinet on Friday. This last-ditch attempt to break a parliamentary deadlock over a key stumbling block of the country's Brexit strategy is poised to form the basis of a long-awaited white paper to be presented to EU counterparts, after the previous two draft proposals were rejected in Brussels.

Oil slid below $74 a barrel in New York after US President Donald Trump urged Saudi Arabia to increase its oil production on Sunday. Technically, the WTI price confirmed the uptrend since January 2016 when it posted a price higher than the $72.83, May 22 high. However, it is also nearing the macro downtrend line since June 2008, at about the $80 level, per the current angle.
In other news, the Mexican peso reversed gains that were spurred by a no-surprise result in the country’s presidential elections. Investors now await to hear populist Andres Manuel Lopez Obrador’s economic program after his landslide win. Technically, the MXN/USD pair has been in an uptrend since July 2017.
The yuan slipped lower for the eighth day out of ten, extending its sharpest drop since August 2015, when the Chinese currency was devalued.
The RBA will meet Tuesday morning for a decision on interest rates, which are widely expected to remain unchanged, due to recent weaker inflation figures and ongoing fears around the impact of a global trade war.
And the downbeat data posted today by both China and Japan only increases concerns over the potential ramifications of the US-China trade dispute.
A plethora of geopolitical and economic headwinds is currently rattling global investor sentiment: the threat of an international trade war that could jeopardize the global economic growth trajectory, multi-layered political risk in Europe and a widening monetary policy divergence between the US and the rest of the world.
Key data coming out in the US at the end of the week could in fact confirm that diverging trend. Minutes from the Federal Reserve’s most recent policy meeting will be published on Thursday, while payrolls figures due on Friday could impact expectations for two more interest-rate hikes this year.
Up Ahead
-
US manufacturing probably continued to expand at a robust pace in June, fresh figures are expected to show today.
-
The Reserve Bank of Australia holds its policy meeting on Tuesday.
-
The US celebrates Independence Day on Wednesday. Stock and bond markets are closed, along with government offices.
-
The Fed releases minutes of its June 12-13 meeting, when FOMC policy makers raised the benchmark rate a quarter point for the second time this year and lifted their median forecast to four total increases in 2018.
-
US non-farm payrolls numbers are due on Friday.
-
Also on Friday, the US is scheduled to impose tariffs on $34 billion worth of Chinese goods. Beijing has said it will slap import taxes on an equivalent-value amount of US exports, including agricultural and auto products.
Market Moves
Stocks
-
The STOXX Europe 600 fell 0.7 percent as of 8:01 a.m. London time.
-
Futures on the S&P 500 dropped 0.5 percent.
-
The MSCI All-Country World Index slipped 0.5 percent.
-
The MSCI Emerging Market Index lost 0.9 percent.
Currencies
-
The Dollar Index gained 0.3 percent.
-
The euro fell 0.3 percent to $1.1648.
-
The British pound slipped 0.3 percent to $1.3172.
Bonds
-
The yield on 10-year Treasuries fell two basis points to 2.84 percent.
-
Germany’s 10-year yield dropped less than one basis point to 0.30 percent, the lowest level in almost five weeks.
-
Britain’s 10-year yield lost one basis point to 1.278 percent.
Commodities
-
The Bloomberg Commodity Index fell 0.5 percent, the most substantial fall in a week.
-
West Texas Intermediate crude fell 0.6 percent to $73.70 a barrel, the first retreat in a week.
-
LME copper dropped 0.8 percent to $6,574.50 per metric ton, the lowest level in about seven months.
-
Gold slipped 0.3 percent to $1,249.15 an ounce.
