- Trump's pessimistic remarks on trade and North Korea spark global equity market selling
- South Korean shares buck the trend as strong corporate performance overshadows mounting political risk
- Japanese shares dragged lower by stronger yen
- Japanese investors sell off Turkish risk, rotate back into yen
- Gold set to slip lower on technicals
- US equities continue to be supported by technicals
Key Events
European shares followed their Asian counterparts lower on Wednesday, mirroring the downbeat sentiment that hit US markets yesterday after geopolitical headwinds resurfaced—more specifically, the on-again/off-again US-China trade war and diminishing prospects of North Korean denuclearization. US futures for the S&P 500, NASDAQ 100, Dow are all flashing red as well, suggesting further losses may lie ahead during the US session.
The STOXX Europe 600 slipped 0.6 percent in early trade, dragged lower by energy and basic resources stocks. As well, after it posted a second record high intraday on Tuesday, the UK's FTSE 100 gave up about half its gains, forming a shooting star. That bearish signal led to a further 0.63 percent slide on Wednesday, as traders and investors await today's CPI release after yesterday's Bank of England inflation report hearings. Data from both will be closely watched as it influences the BoE's next interest rate decision this summer.
The British benchmark index took its cue from the US's small cap Russell 2000, which completed a bearish engulfing pattern yesterday and is currently pointing to further declines. However, the two indices are also the only two major global averages to trade around new record highs since the recent broader equity market correction.
Global Financial Affairs
US President Donald Trump sparked a fresh wave of market jitters on Tuesday when he said his administration has yet to reach a deal with Chinese officials over Chinese smartphone and networking accessory manufacturer ZTE (HK:0763), which faces estimated losses north of $3 billion if a US ban on purchases of its products and sales of US-made chips to the company takes place. Adding fuel to the fears Trump added he is “not satisfied” with the progress of trade talks, further hampering investor optimism over a diplomatic breakthrough.
Traders seemed to abide by the maxim "buy the rumor, sell the news": they drove prices higher after the opening bell, on reports of a ZTE deal that would spare the Chinese company from ban-related losses through a more limited $1.3bn fine; but later sold their positions on Trump's remarks.
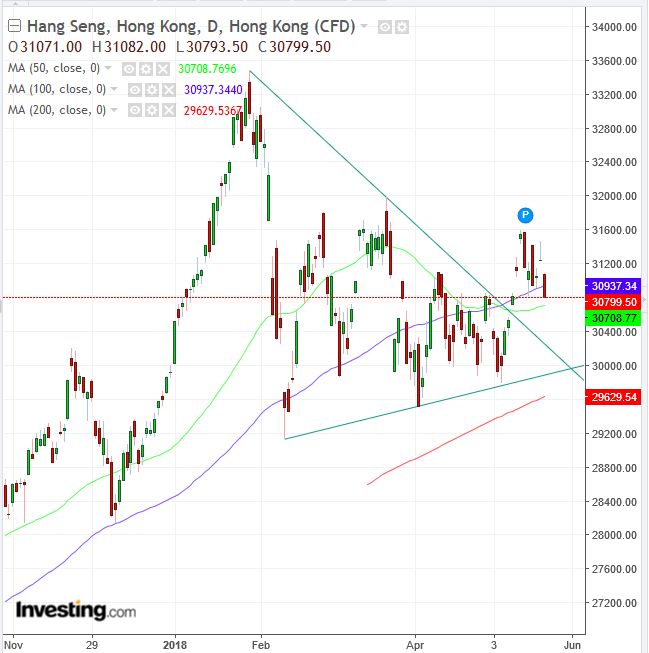
China's Shanghai Composite and Hong Kong's Hang Seng both dipped 1.4 percent, weighed down by coal miners and financial firms. The mainland index is trading at the bottom of the day. Technically, the price is piercing the 50 DMA, while strongly confirming a hanging man, an omen that the 5 percent rally from the April-18 low may be over.

Meanwhile, the Hang Seng has pierced through the 100 DMA, while remaining above the 50 DMA. After a 3-percent penetration breakout of a symmetrical triangle, this may be considered a corrective return-move and therefore a buying dip.
South Korea’s KOSPI bucked the downtrend seen across regional indices, climbing 0.28 percent. Large caps led the gains, with Samsung Electronics (KS:005930) jumping 3.2 percent and chipmaker SK Hynix (KS:000660) spiking nearly 7 percent, hitting its highest close since mid-2001. This bullishness is even more impressive considering it occurred just as the won was strengthening by 0.67 percent and trading at the height of the session.
Moreover, it underscores a tendency among traders to focus more on company performance than geopolitical risks; they seemed to shrug off heightened political fears from north of the border. Trump said on Tuesday that there was a "substantial" chance the June 12 meeting with North Korea may in fact not take place, spoiling hopes of the nuclear summit taking place.
Down under, the S&P/ASX 200 dropped 0.15 percent as a retreat in oil prices weighed down on energy shares. The decline brings the Aussie benchmark's five-day combined losses to 1.66 percent.
Japan’s TOPIX slipped 0.67, to a three-day slide of 0.99 percent, after Monday’s shooting star confirmed Friday’s hanging man. The Nikkei 225 plunged 1.15 percent, to a combined two-day decline of 1.3 percent. Wednesday's losses marked a break below an uptrend line since March 26 for both indices.

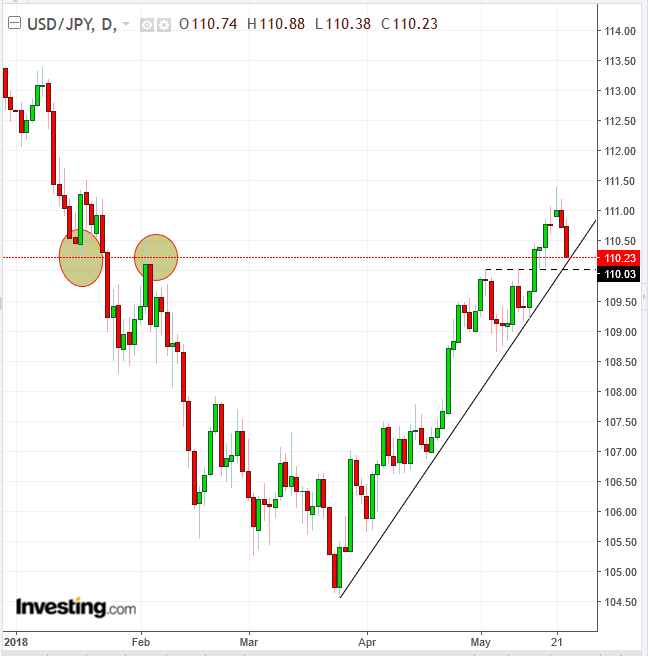
Japanese stocks were weighed down by a stronger yen, which ticked 0.44 percent higher, extending its rally to a second day (after Monday's shooting star) for a combined 0.65 percent gain against the dollar. Technically, the USD/JPY is testing a dual support of an uptrend line since March 26—matching uptrend lines of the Nikkei and broader TOPIX—and the broken resistance on May 2 and May 10, which confirmed the 110.00 level as a significant support-resistance level in January and February.
The yen rally followed the slew of re-ignited geopolitical risks, which also resulted in increased demand for US Treasurys, in turn sending yields on 10-year notes lower but still above the key 3.00 percent mark.
We maintain though that the safe haven currency is benefiting from a a different, more local driver: the repatriation of Japanese investors, who extensively shed their Turkish bond holdings. While Japanese investors are typically conservative, negative domestic yields had incentivized them to look for more profitable assets—in the form of the 14 percent yield offered by Turkish bonds, which they were willing to increase exposure to despite Turkey's double-digit inflation and a growing current account and budget deficits.
Much of the current economic turmoil in Turkish assets comes after the country's President Recep Tayyip Erdogan said he sought to tighten control over monetary policy and the country's economy if he wins next month’s presidential election. For years, Erdogan has tended to prioritize pleasing his base over what economists and foreign investors consider sound economics. The Turkish lira has plunged 22 percent against the yen since the beginning of the year, suffering an even heavier slump than against the dollar (- 20 percent). Japanese investors took advantage of a thin market in the early session and dumped Turkish assets, at the same time bidding up the yen.
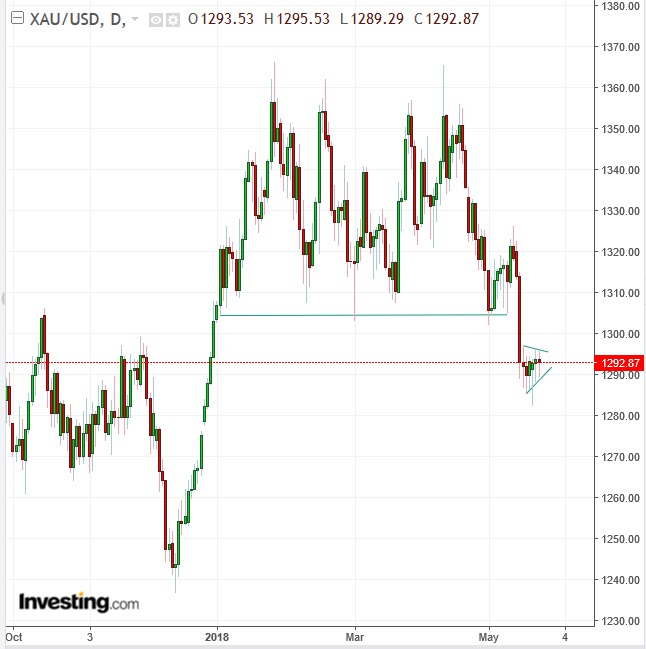
Our thesis, that the yen's climb is mainly driven by Turkish factors, is supported by the fact that gold is currently lower, despite the growing demand for secure assets amid mounting geopolitical uncertainty.

The price of gold is forming a continuation pennant, after a downside double-top breakout, suggesting a repeat of the rapid 2.8 percent preceding decline earlier in the month.
We have been pointing out for over a year now that there is growing evidence of the dwindling impact on investors of geopolitical jitters, since after the Brexit vote of June 2016. Having said that, this year’s double-digit equity correction—the first in two years—suggests that investors might be developing a fear of heights: they seem to prefer taking profits when the market is robust but geopolitical risk is piling up, which may lead to a second market correction this year.

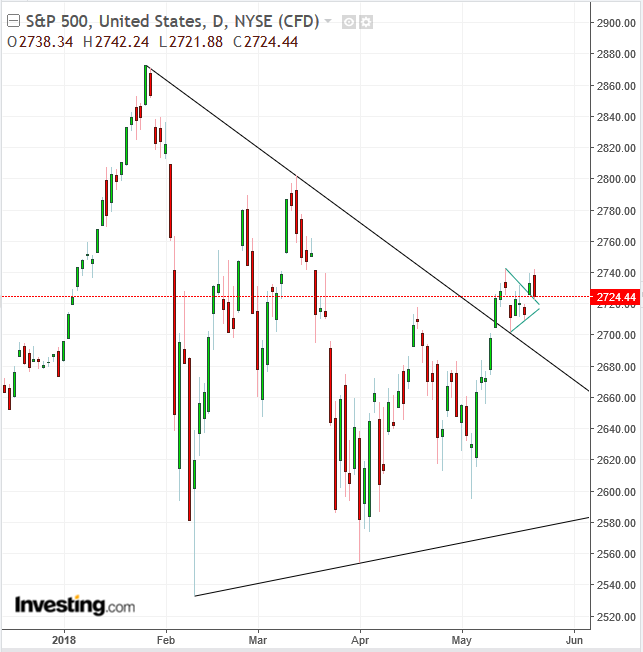
Technically, the price of the S&P 500 remained above the continuation pennant pattern, which is an upside breakout of a continuation symmetrical triangle. This suggests there might be enough demand in play to repeat the five-percent bounce the US major index enjoyed in the early part of the month.
Meanwhile, investor focus will shift to the release of minutes from the last FOMC monetary policy meeting later today, to be followed by the ECB monetary report tomorrow.
Up Ahead
-
The Federal Reserve releases minutes of the central bank’s May 1-2 meeting on Wednesday; US new home sale and euro-area PMIs.
-
Thursday, the Bank of England Markets Forum takes place at Bloomberg London. Speakers include BOE Governor Mark Carney and New York Fed President William Dudley.
-
A St. Petersburg Forum panel this coming Friday includes Russian President Vladimir Putin, France's PM Emmanuel Macron, IMF Managing Director Christine Lagarde, and Japan's PM Shinzo Abe
-
Also on Friday, European Union finance ministers discuss the latest Brexit developments in Brussels.
Market Moves
Stocks
-
The STOXX Europe 600 slid 0.3 percent.
-
The UK’s FTSE 100 fell 0.2 percent, the largest dip in almost three weeks.
-
Germany’s DAX lost 0.2 percent.
-
The MSCI Asia Pacific Index fell 0.4 percent to the lowest in two weeks on the largest fall in more than a week.
-
Futures on the S&P 500 Index slipped 0.2 percent.
Currencies
-
The Dollar Index gained 0.46 percent, challenging Monday’s intraday high.
-
The euro fell 0.3 percent to $1.1739, the weakest level in six months on the largest fall in more than a week.
-
The British pound fell 0.4 percent to $1.338, the weakest level in 21 weeks on the biggest fall in more than a week.
-
The Japanese yen gained 0.5 percent to 110.30 per dollar, the strongest level in more than a week on the largest climb in almost three weeks.
Bonds
-
The yield on 10-year Treasuries dipped three basis points to 3.03 percent, the lowest in more than a week.
-
Germany’s 10-year yield decreased three basis points to 0.53 percent.
-
Britain’s 10-year yield declined five basis points to 1.523 percent.
-
Japan’s 10-year yield sank one basis point to 0.044 percent, the lowest in more than three weeks on the biggest tumble in more than three weeks.
Commodities
-
West Texas Intermediate crude sank 0.4 percent to $71.92 a barrel, the biggest dip in more than a week.
-
Gold fell less than 0.05 percent to $1,290.64 an ounce.
-
LME copper fell 0.8 percent to $6,924.00 per metric ton.
