Street Calls of the Week
Yesterday, all four major US indexes registered new all-time highs, only to close lower for the day, as commodities producers and industrial equities were sold off after a decline of oil and metals.
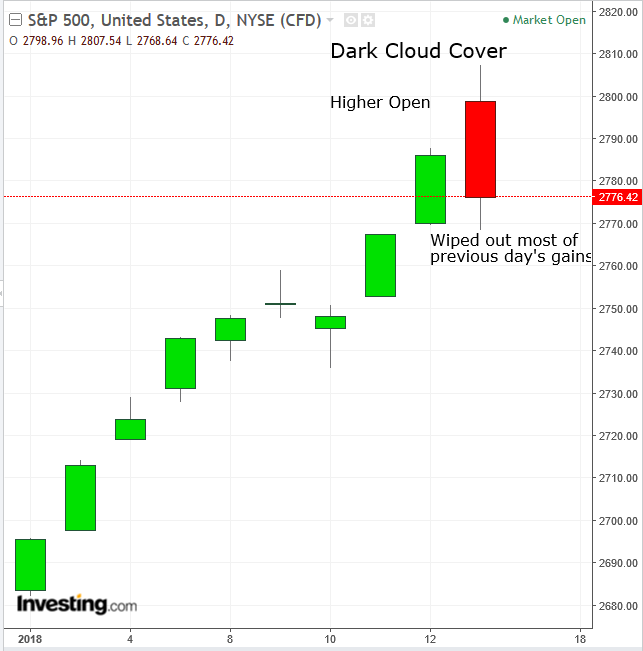
The S&P 500 index rose 0.75 percent and closed 0.35 percent lower. It fell more than a whole percentage point from the session high, forming a Dark Cloud Cover, a dual candle pattern that is a top reversal after an uptrend. The depth of the second, bearish candle closed below the half-mark point of the first, bullish candle, satisfying even a conservative read. The rationale behind this bearish pattern is that the higher open of the second day resumes the preceding up-day, letting the bulls feel like they’re in control, lulling them into complacency.
Before close however, the bears executed a sneak attack, pushing the bulls back not only beneath the prior close but well within the prior day’s real body, offsetting much of the gains, and upsetting what was considered the status quo. Traders with longs, who may have second thoughts about their current positions, may begin liquidating, adding to the supply price-pressure, allowing bears to strengthen their foothold into what was considered bull’s territory by bolstering defenses. Additionally, they may feel that this is the best time to mount an all-out offensive, while the bulls are on the run, liquidating positions and driving prices down further.
The Dow Jones Industrial Average rose more than a full 1.00 percent and closed nearly flat, 0.03 percent lower. While it didn’t form a Dark Cloud Cover, traders’ behavior resulted in price action that may have portrayed the same dynamic. After blowing past the round-number milestone – letting the bulls feel in charge – the oldest index in the world fell almost 300 points from its intraday high of 26,086.12. This sudden turn may have given bulls pause, in the same way the dual candle pattern may have given pause to S&P bulls.
The NASDAQ Composite rose 0.95 percent and closed 0.75 percent lower. With a bigger gain as well as a bigger loss, the Dark Cloud cover may leave a stronger impression on traders within the described dynamic, sending a more potent bearish signal.
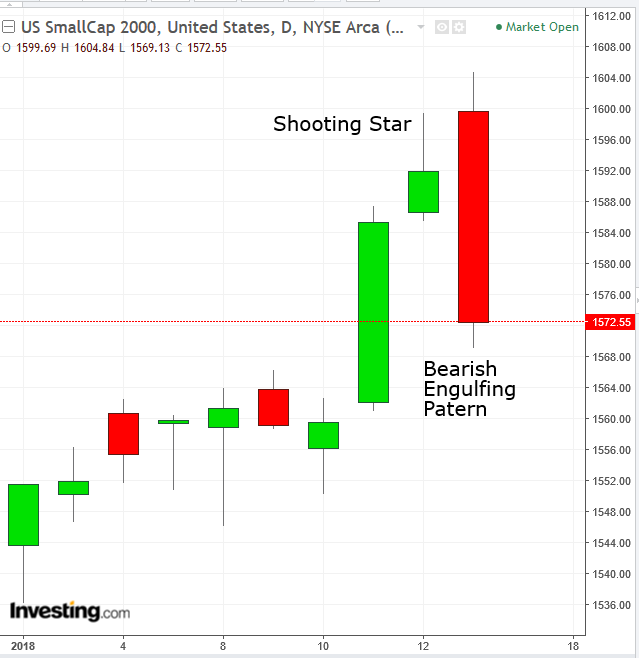
The Russell 2000 rose 0.80 percent and closed 1.22 percent lower, producing by far the strongest bearish signal. It produced a Bearish Engulfing pattern which is a stronger bearish signal than the Dark Cloud Cover. The down day didn’t only penetrate into the preceding up day’s gains but wiped them out completely, “engulfing” it. The more the red candle engulfs, the stronger the potential impact. This red candle wiped out more than a day and a half of gains, hitting the bulls hard. Note that the preceding day, while we had a green candle, the bears were more impatient than with the other indexes, pushing more than halfway down before closing, forming a bearish shooting star, which forewarned of the following day’s decline.
Internally, the S&P 500 sectors that led yesterday's declines were Energy (NYSE:XLE; -1.27 percent), followed by Materials (NYSE:XLB; -1.17 percent) and Industrials (NYSE:XLI; 0.90 percent). The only three sectors that were green, dragging their heels into the ground, were Health Care (NYSE:XLV; 0.50 percent), Real Estate (NYSE:XLRE; 0.48 percent) and Consumer Staples (NYSE:XLP; 0.46 percent).
Today, Asian traders took cue from US counterparts and decided it was an appropriate time to take profits, pulling prices down from record highs. To that effect, benchmarks in Sydney and Tokyo were lower, pulling down the MSCI Asia Pacific Index on healthcare, materials and energy, mirroring the decline of the US market leaders. The bright spots were Chinese shares: the mainland’s Shanghai Composite gained 0.24 percent and Hong Kong’s Hang Seng advanced 0.25 percent.
However, a deeper look at the Shanghai Composite’s gain reveals a more complex picture. While it did gain 0.24 percent, that was pared from an earlier 0.82 percent; it was also 0.17 percent in the red during trading. All this up and down with a close a mere 0.02 percent above its open formed a high wave candle. The extreme volatility projects a lack of leadership and often appears before reversals.
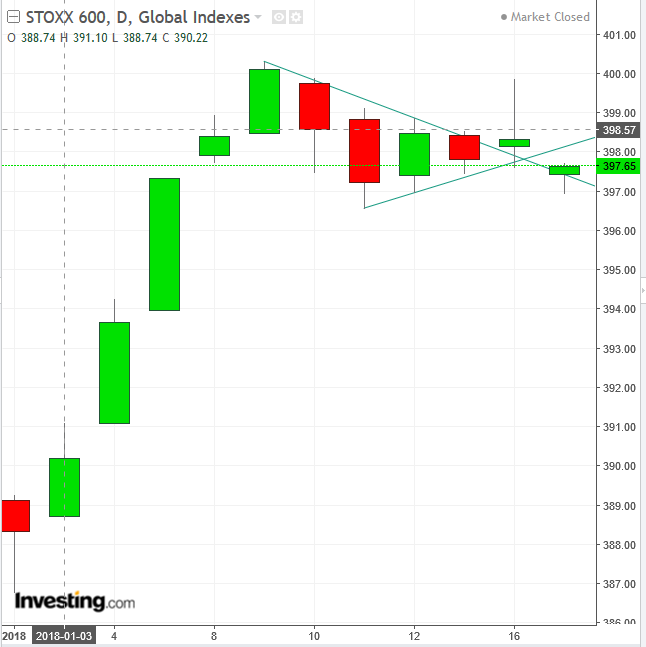
European traders joined the trend lower. The Stoxx Europe 600 index resumed a bearish push-back from yesterday’s near 400 intraday high, paring a 0.53 percent advance, its largest since January 5, to just 0.13. It opened 0.22 percent lower and has eked out a 0.01 percent gain. Technically, it has broken down an upside breakout of a bullish pennant pattern. The negative sentiment has overcome the presumed boost to stocks from a weaker euro.
While some consider the about-face as a healthy correction in stocks, others consider the reversal's intensity to reflect the ambivalence of traders who may be second-guessing themselves on the pace of gains in equity markets since the start of the year. This is seen more vividly via the bond market, with the persistently flattening yield curve after institutions enjoyed an all-too-brief sigh of relief when the yields moved in opposite direction earlier in the month.
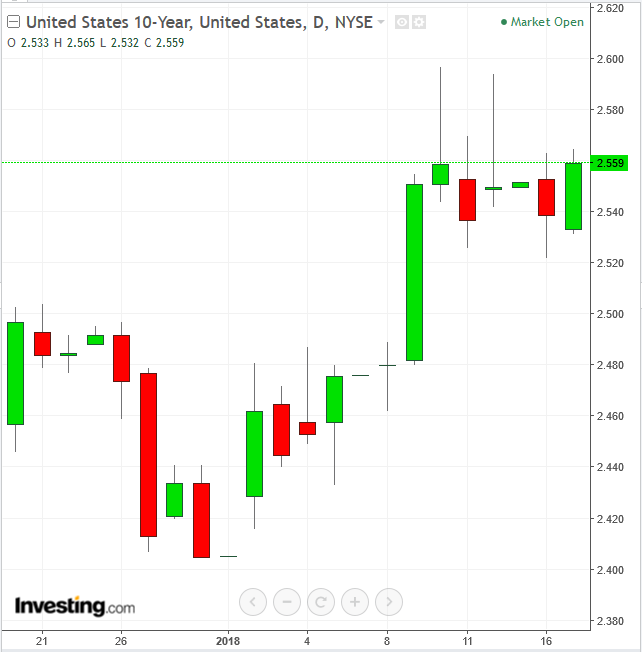
The U.S. 10-Year Treasury yield rose toward the top of a trading range of a week, amid Congressional talks to avert a government shutdown Friday.
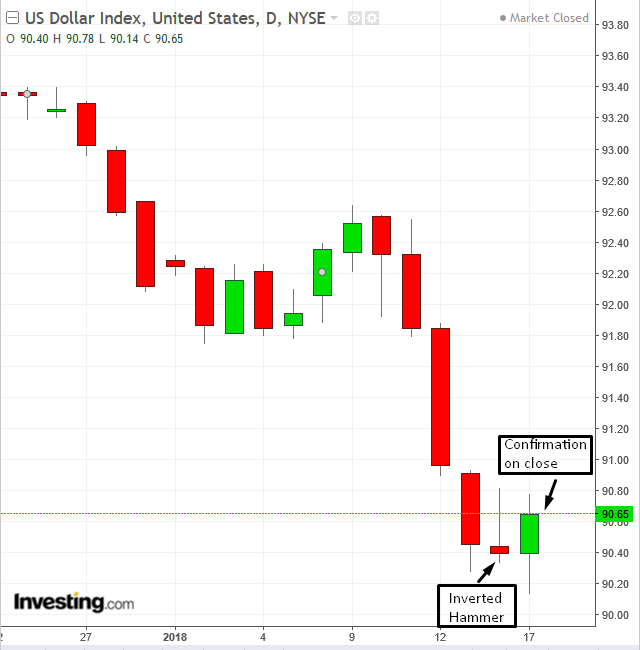
The dollar index fell yesterday for a fifth day. However, its last decline was in the form of an inverted hammer, a bullish candle upon confirmation with a close above its real body. Today, the dollar gained for the first time since January 9. Not only did it climb higher than yesterday’s real body, but it pared most of Monday’s losses.
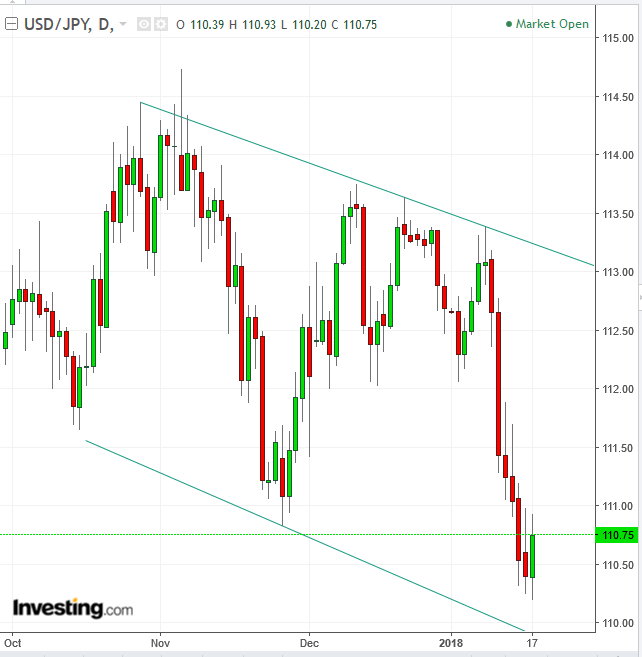
Yesterday, the yen climbed for a sixth straight day despite a warning from Japan’s finance minister about excessive swings in the forex market. Today, the yen and pound were among the other major currencies slipping against the greenback. The euro retreated from a three-year high against the greenback and sterling slipped.
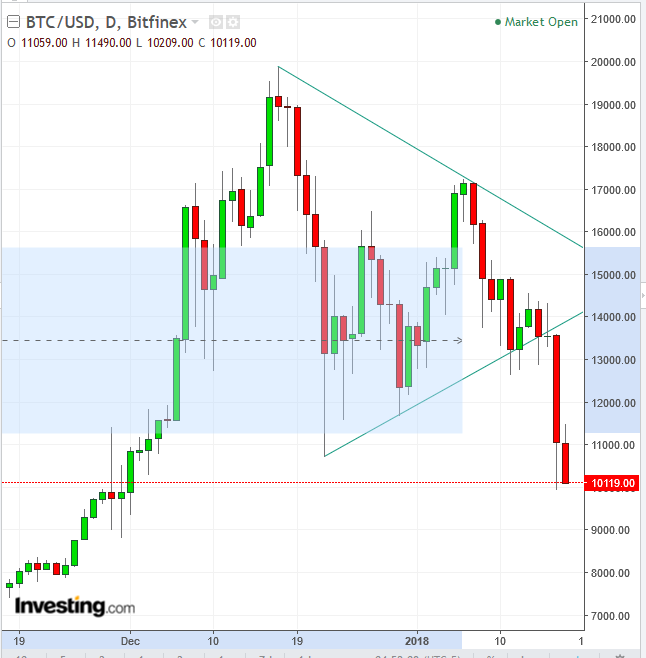
Bitcoin joined a selloff of cryptocurrencies, plunging almost 27 percent to nearly $9.949.40, which is more than the universally accepted reversal into a bear market (in a normal market). Technically, the lead digital currency did in fact enter a bear market as yesterday's trough registered lower than the December 22, $10,718 low. It also provided a down-side breakout of a symmetrical triangle, with 18 percent of a red real body, the longest in its history, like a long bloody finger pointing the way down. The fact that a symmetrical triangle (whose bias is to resume with the prevailing trend) failed, only demonstrates how negative the sentiment is, potentially setting a harder course of reversal.
Up Ahead
- Taiwan Semiconductor Manufacturing Co. (NYSE: TSM), Bank of America Corp (NYSE:BAC) and Goldman Sachs Group Inc (NYSE:GS). are among notable earnings releases on the cards.
- Industrial production in the U.S. which reports today most likely increased in December, which will complete a solid year for manufacturing.
- U.S. housing starts probably slipped in December for the first time in three months due to frigid winter weather which impeded work, forecasts predict ahead of Thursday’s release.
- The Bank of Canada’s interest rate decision comes today. Monetary policy announcements are also due this week in South Korea, South Africa and Turkey.
- China releases fourth quarter GDP, December industrial production and retail sales Thursday.
Stocks
- The Stoxx Europe 600 Index dipped 0.3 percent as of 9:37 a.m. London time (4:37 EST).
- The MSCI All-Country World Index fell 0.1 percent.
- TOPIX index fell 0.2 percent.
- Hong Kong’s Hang Seng Index declined 0.1 percent.
- KOSPI Index sank 0.3 percent.
- Australia’s S&P/ASX 200 Index declined 0.5 percent to the lowest in more than a month on the largest fall in a week.
- The U.K.’s FTSE 100 Index sank 0.3 percent to the lowest in more than a week on the largest decrease in more than a week.
- Germany’s DAX Index dipped 0.2 percent.
- The MSCI Emerging Market Index gained less than 0.05 percent to the highest level in almost 10 years.
- Futures on the S&P 500 index climbed 0.2 percent.
Currencies
- The dollar index rose 0.27 percent, the first advance in more than a week.
- The euro declined 0.2 percent to $1.2235, the biggest drop in more than a week.
- The British pound declined less than 0.05 percent to $1.3787, the largest fall in a week.
- The Japanese yen sank 0.3 percent to 110.77 per dollar, the first retreat in more than a week.
Bonds
- The yield on 10-year Treasury gained two basis points to 2.56 percent, the highest level in a week.
- Germany’s 10-year yield fell one basis point to 0.55 percent.
- Britain’s 10-year yield fell one basis point to 1.291 percent, the lowest level in a week.
Commodities
- Gold declined 0.2 percent to $1,335.34 an ounce, the biggest drop in more than a week.
- West Texas Intermediate crude declined 0.2 percent to $63.59 a barrel, the lowest in a week.
