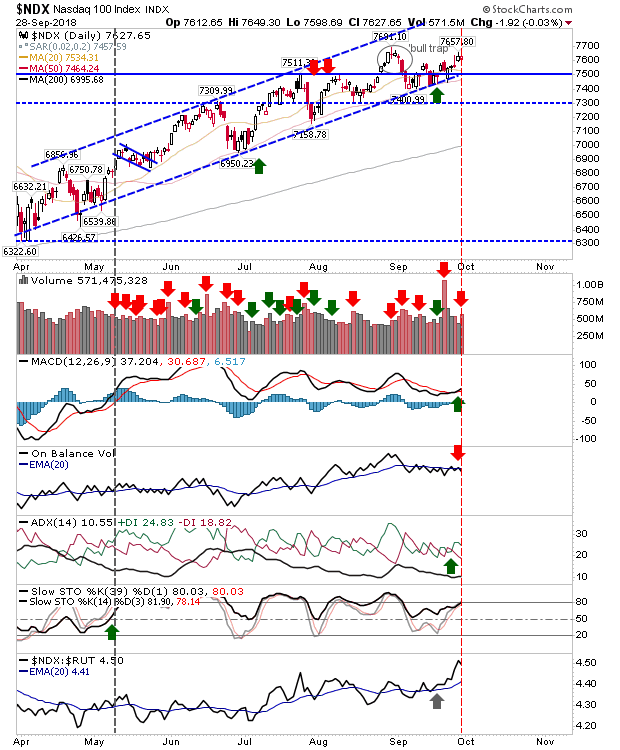
The NASDAQ 100 is the one index which looks ready to break higher as it pressures the August 'bull trap'. While Friday ranked as higher volume selling - technical distribution - the loss was small and the index continues to push against resistance. Technicals are mixed with a 'buy' trigger in the MACD offset a weak 'sell' in On-Balance-Volume. The main positive is the surge in relative performance against the Russell 2000.
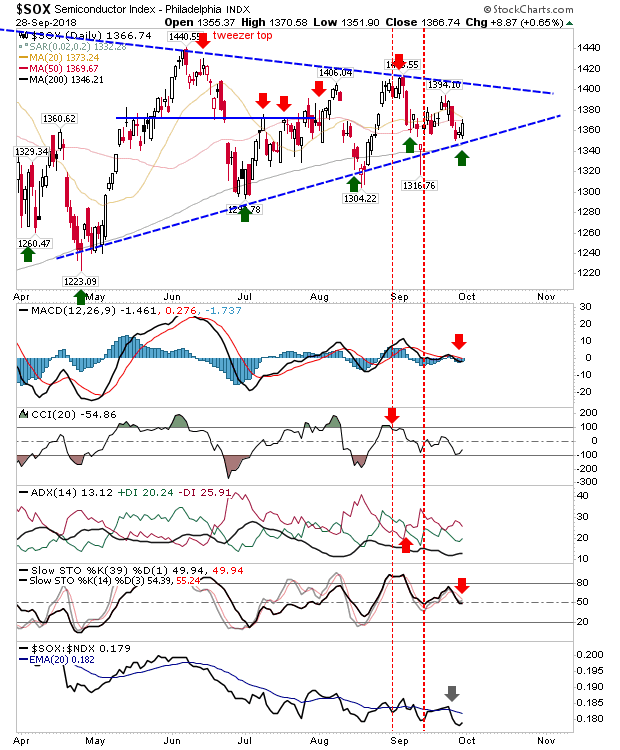
Whether the NASDAQ 100 is able to break past its 'bull trap' will probably depend on whether the Semiconductor can resolve its consolidation triangle to the upside. Interesting play for the Semis with a dig-in just above rising support (below a flat-lined 50-day MA) but all technicals net bearish. From a pure price perspective, it's a support 'buy' with stops on a loss of 1,350.
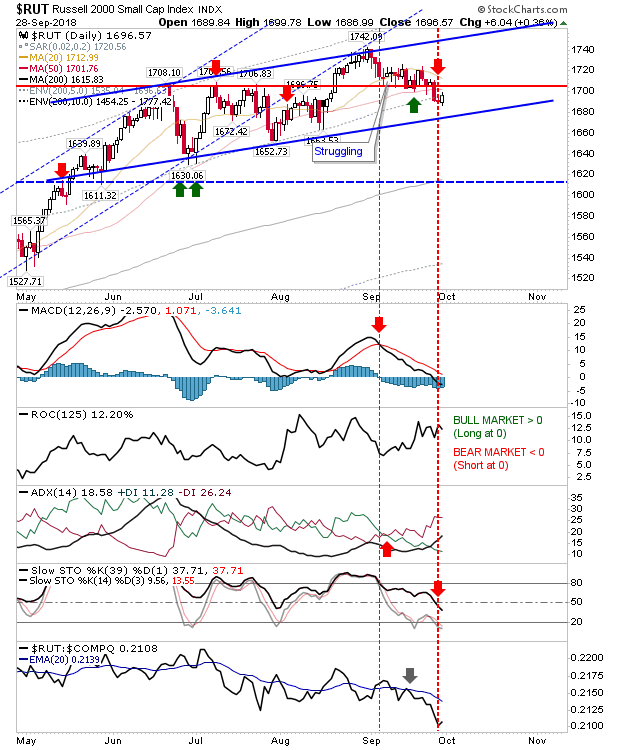
An index feeling the pressure is the Russell 2000. Wednesday saw the break of the 50-day MA and a drop outside of prior congestion but Friday saw a dig in even if there is no natural support nearby. Technicals turned net negative on Friday saw the expectation would be for the attempted bounce from Friday's bullish engulfing pattern to fail.
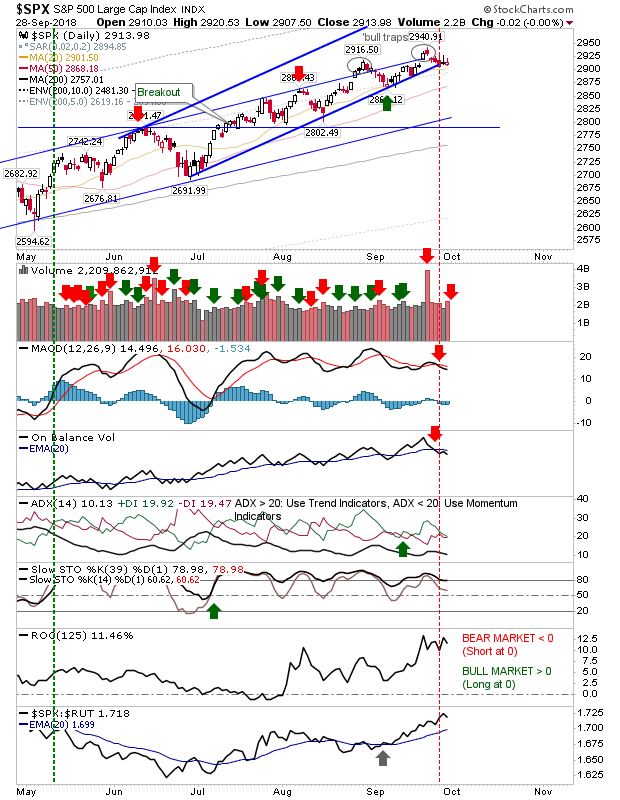
Large Caps are playing a waiting game. The sequence of doji in the S&P 500 lingering on wedge support suggest indecision and a lack of desire from both bulls and bears to drive the market in their favoured direction. Daily ranges are tight, so there is no real impetus to break the range. This looks like a setup for a move to rising channel support (c2,825) but there needs to be a solid break down - which may happen Monday.
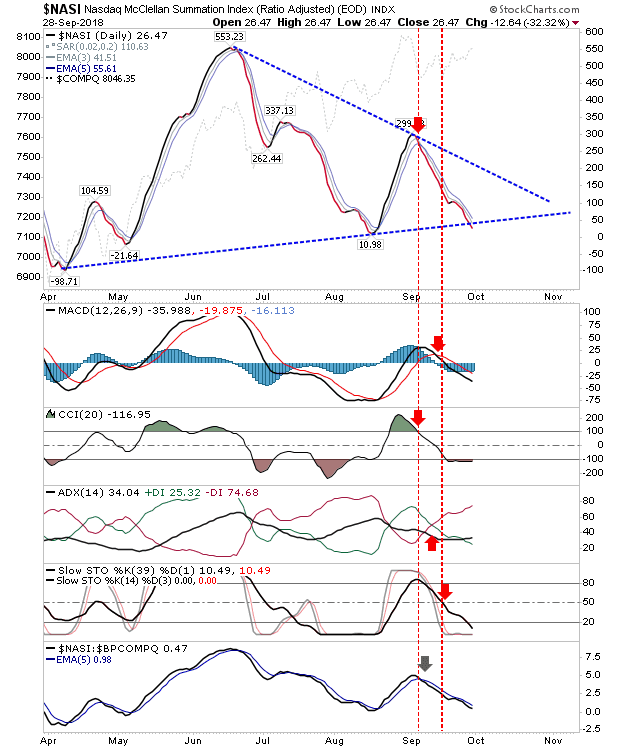
On breadth metrics, the Nasdaq Summation Index is pointing to a breakdown; this will be bearish for the NASDAQ Composite and NASDAQ 100.
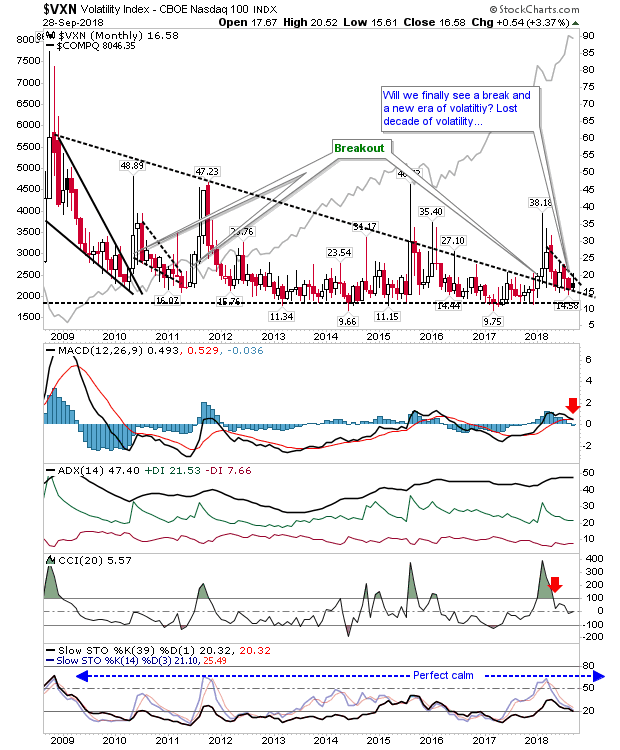
Volatility keeps building towards a breakout with a small bullish wedge on a larger consolidation (triangle). I'm liking an upside break to 40+ but as this is a monthly chart this could be 6-months away from kicking off and maybe a year from reaching into the 40s.
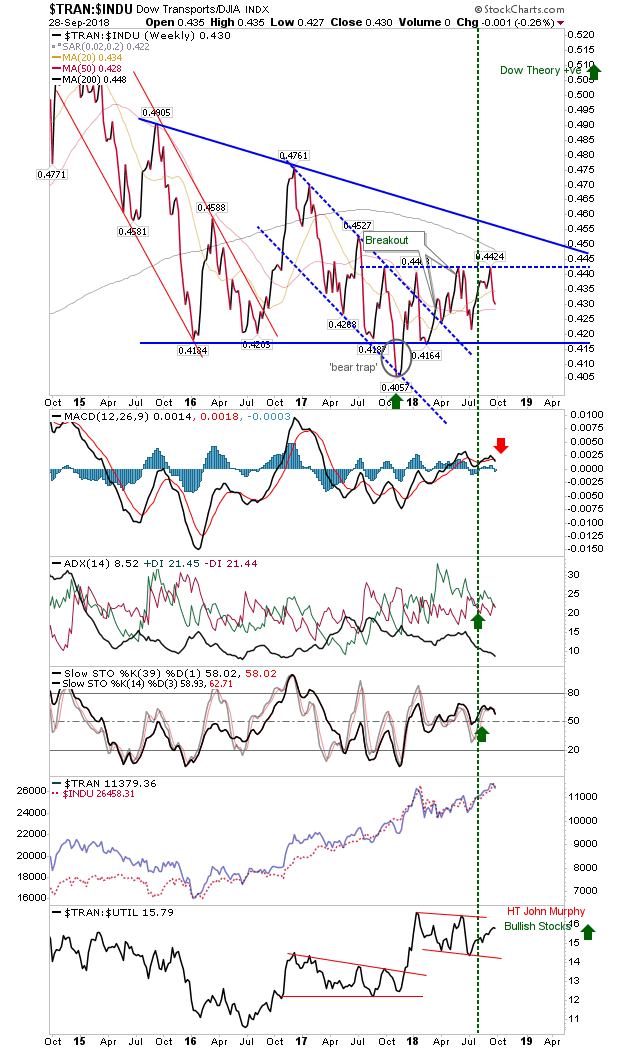
Another interesting chart is the relative relationship between the Dow Industrial Average and Dow Transports (for followers of Dow Theory). This relative relationship has emerged from what had been a steady decline into a sideways consolidation around key moving averages. The likelihood is for a break higher which will be bullish for the Dow Industrials (and SPX) but for now this is in wait-and-see mode.
For tomorrow, watch the Semiconductor Index and NASDAQ 100 index; bulls have most to gain from here. Shorts can look to the S&P 500 - at least for a move back to channel support.
