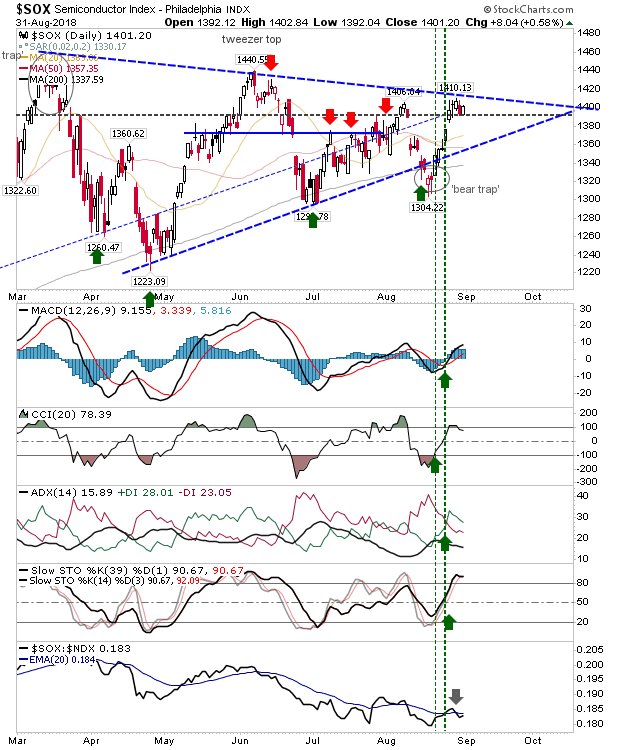
Before my vacation I had noted three indices to watch undergoing support tests: Semiconductors, NASDAQ and Dow Jones Industrial Average had all presented buying opportunities. However, I had also thought these rallies would stall out when they got back to resistance - this did not prove to be the case. With the exception of the Semiconductor Index (which did rally), all indices managed to post new highs for the summer.
The Semiconductor Index is the one which may present a profit taking opportunity (or a potential shorting chance) as it approaches triangle resistance. Given both the NASDAQ and NASDAQ 100 are at new multi-year highs and technicals for the Semiconductor Index are net bullish - and this rally begun from a 'bear trap' - chances are this will continue beyond 1,410 and go to challenge 1,440 and likely more.
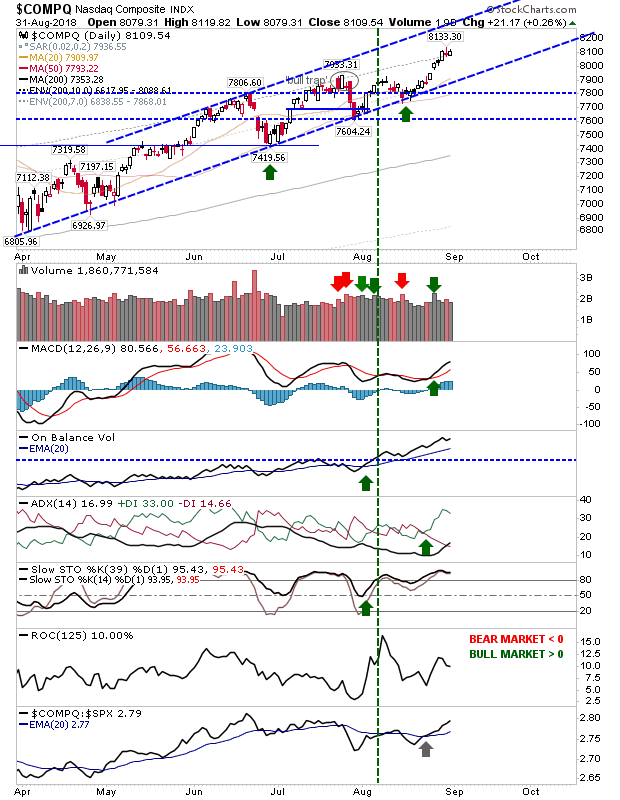
Speaking of the NASDAQ. It successfully navigated a bounce off its 50-day MA and is now working its way towards channel resistance. Volume action is relatively tame but supporting technicals are in good shape and are net bullish; a pullback to channel support would likely be another buying opportunity.
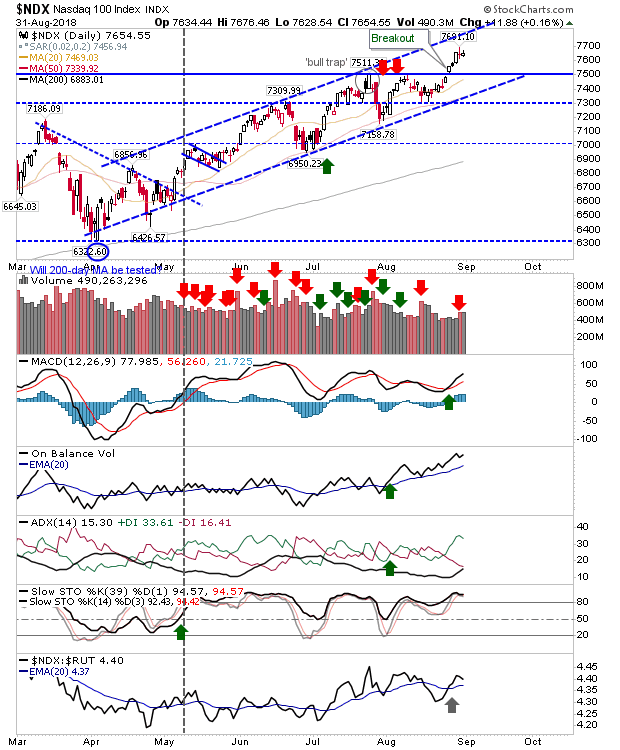
It's a similar story for the NASDAQ 100; it's undergoing a move to channel resistance with bullish technicals. Momentum players can use narrow range days like Friday's to enter a swing trade; stop on opposite side of high/low break with channel resistance/support as a price target.
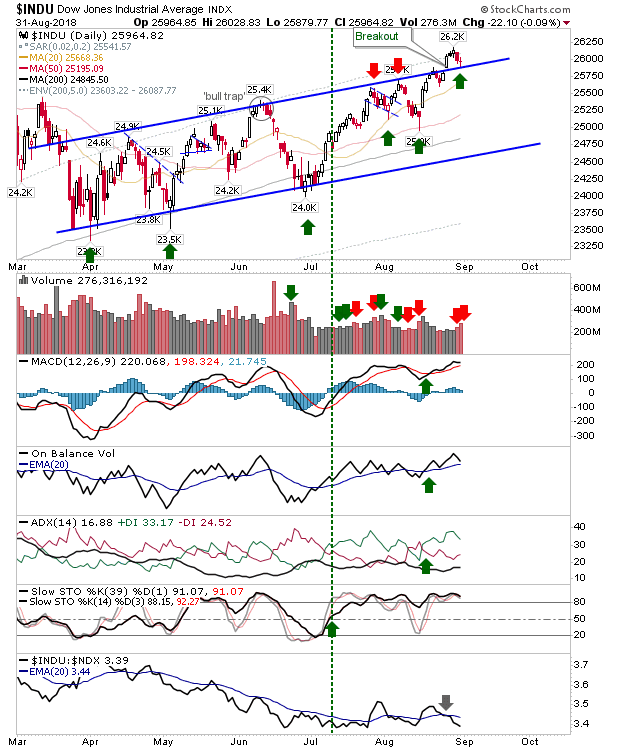
The Dow Jones may already be offering a new buying opportunity as Friday's pullback tagged channel resistance. The pre-holiday 'bullish hammer' proved to be an excellent long side opportunity but Friday's finish could offer something for late-comers; the 20-day MA as an alternative entry point for those seeking more value,
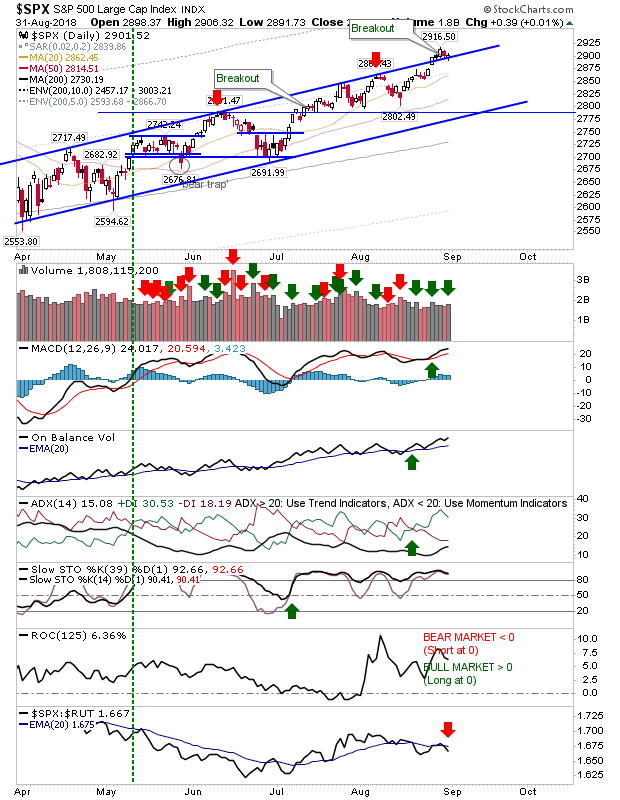
The S&P also cleared channel resistance in an acceleration of its rally. The pick-up is modest but the lack of overhead supply makes it a potential long side play.
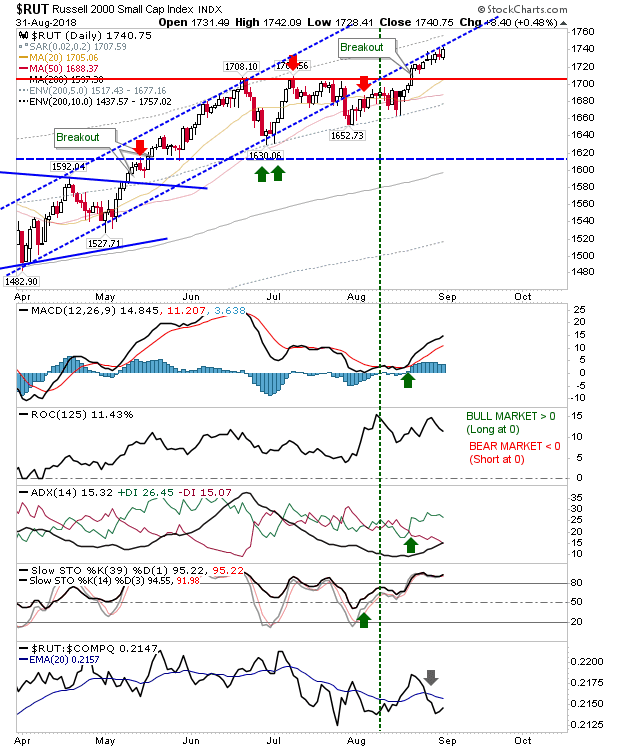
The Russell 2000 is an interesting scenario. The channel breakdown looked problematic but it managed to mount a breakout, yet remained contained by former channel support turned resistance. Relative performance is a mixed bag which favors weakness but price action has so far defied that assessment.
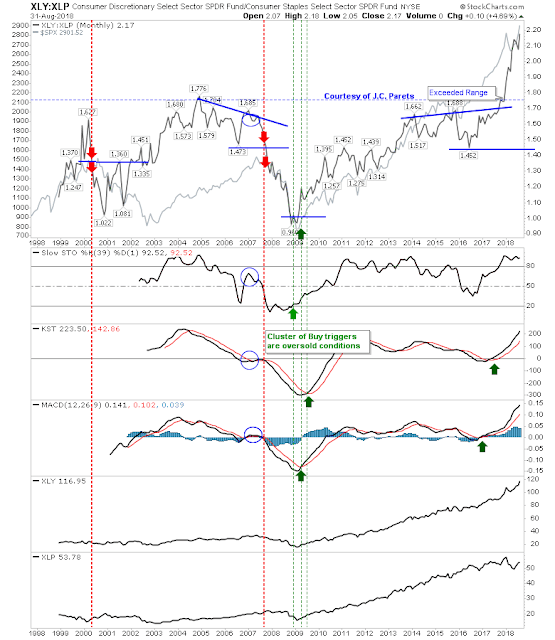
The ratio of Discretionary and Staples has moved well outside of its historic range as Discretionary stocks kicked on after Trump's election. This ratio is well away from a new 'sell' trigger - a 'sell' trigger which could be months if not years away. Long-term shareholders can take comfort in this.
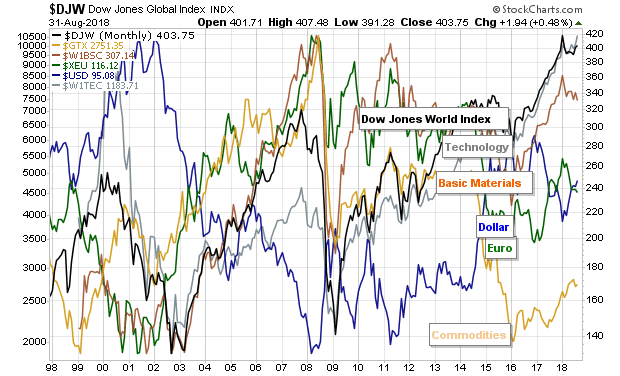
In terms of long-term buying opportunities, commodities are the value play while global stocks are looking overvalued and ripe for profit-taking.
For Tuesday, look to buy the S&P and Dow Jones Industrials, watch Semiconductors for a potential breakout. Other indices are a hold.
