There wasn't a whole lot to Friday's action but the main thing was an advance against the tentative weakness which shaped up last week.
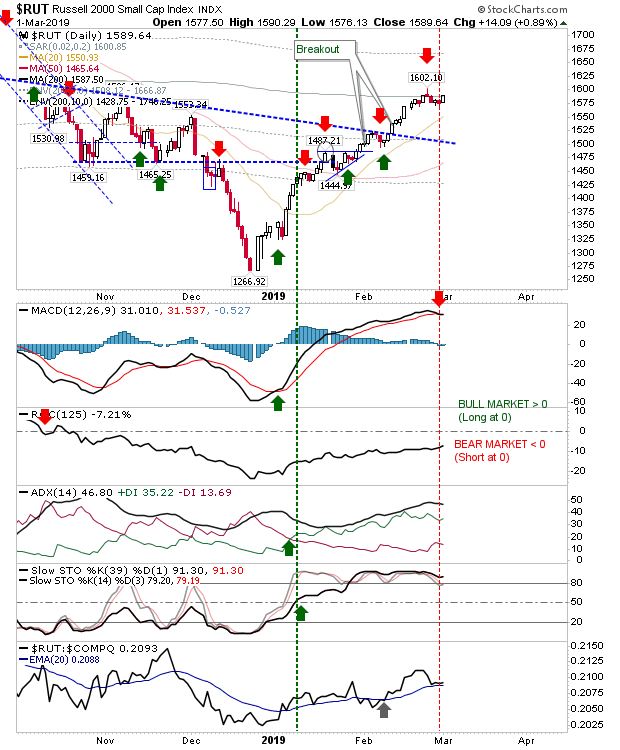
Best of the action was the Russell 2000 as it gained nearly 1% to bring it back to its 200-day MA. Monday could be a critical for the index; look for a push above this moving average to follow the lead of peer indices. The index is also enjoying a relative performance advantage against the NASDAQ and S&P; so if money is going to flow into an index it's going to be the Russell 2000.
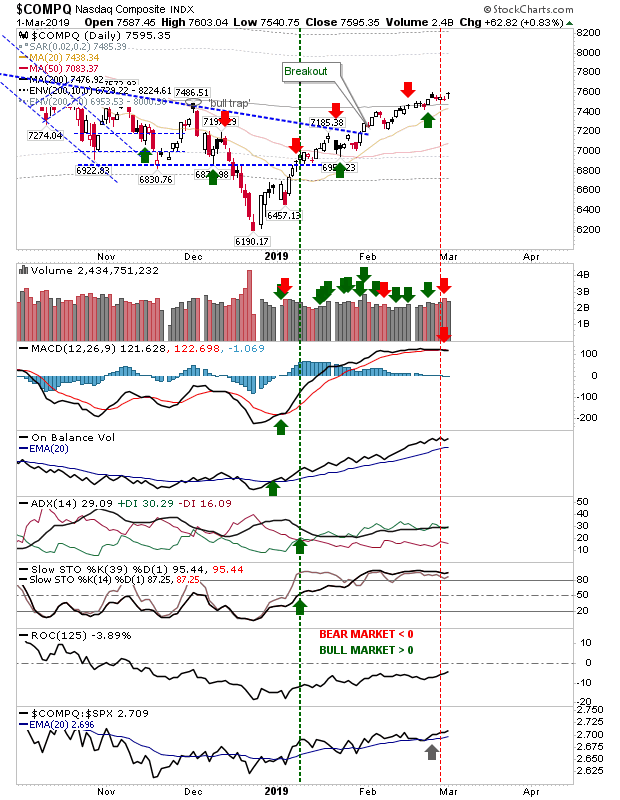
The NASDAQ did not enjoy the same percentage gains as the Russell 2000 but does benefit from the fact it's currently trading above its 200-day MA. Also, while the Russell 2000 is outperforming both the NASDAQ and S&P, the NASDAQ is managing to outperform the S&P. While bulls may want to jump aboard the Russell 2000, the NASDAQ is perhaps the safest bet with a stop below the 200-day MA.
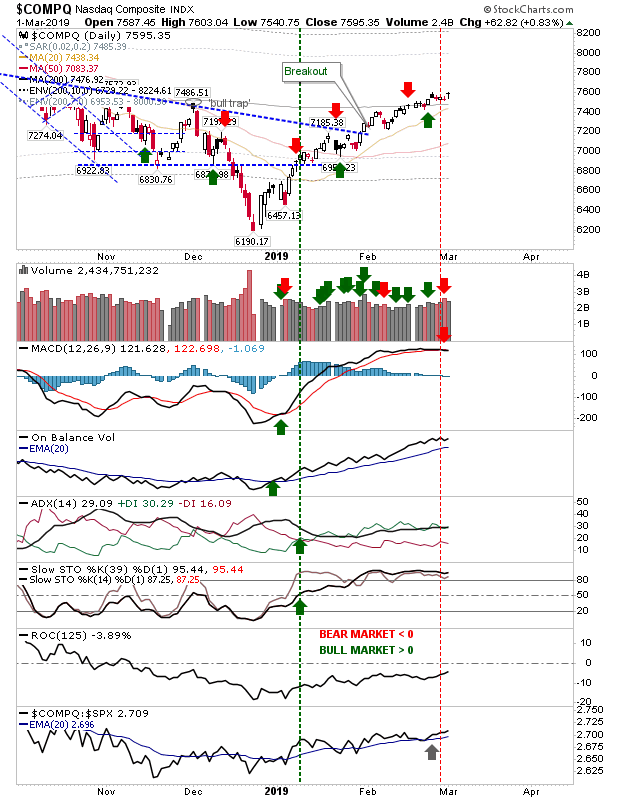
The S&P had offered a possible 'bull trap' on Friday but it did manage to break beyond the pattern high to negate the 'bull trap' and open up the possibility for a fresh breakout.
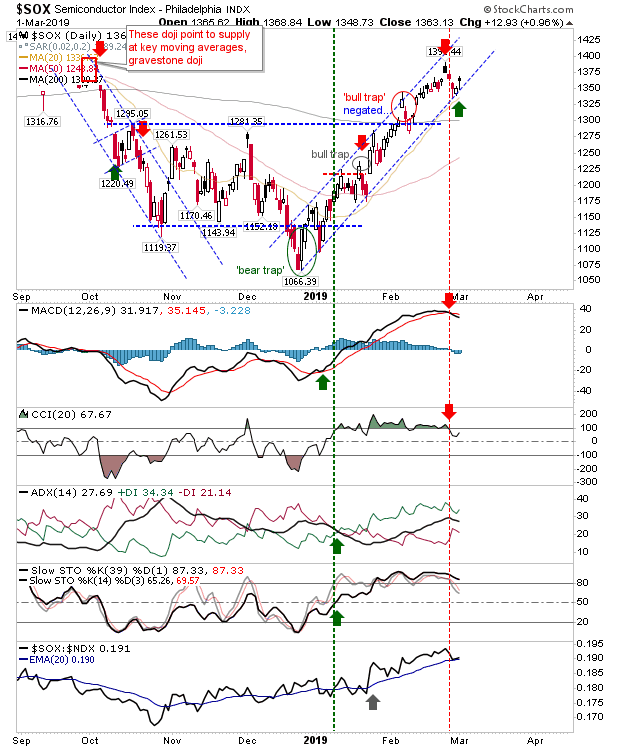
The Semiconductor Index bounced off channel support on Friday. The doji was a little disappointing but larger price behavior is supporting the bounce off the channel. Technicals are still mixed with a 'sell' trigger in the MACD and CCI, but I would consider price action as key and let the bounce play out as it may.
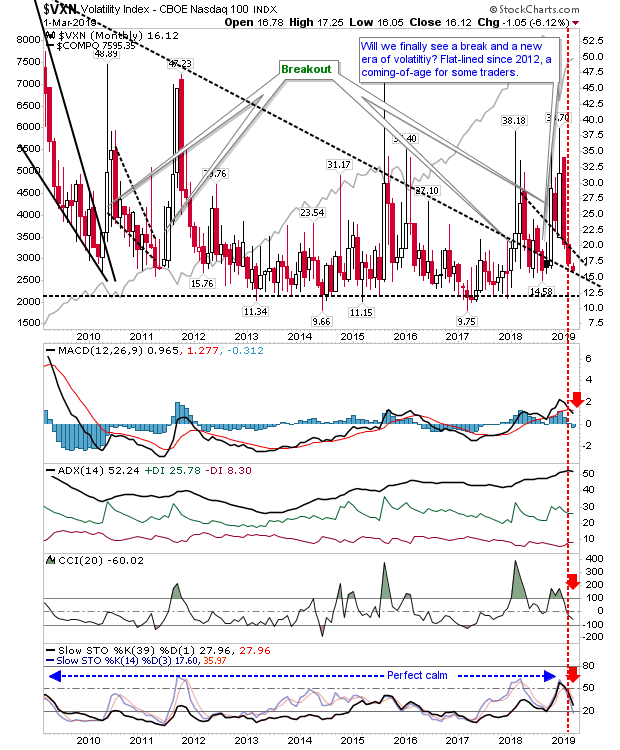
Other areas to watch include volatility. The VXN has made a deep retreat after a tumultuous 2018. After a six year lull, volatility looks to be back in play so another run higher may come sooner than we think.
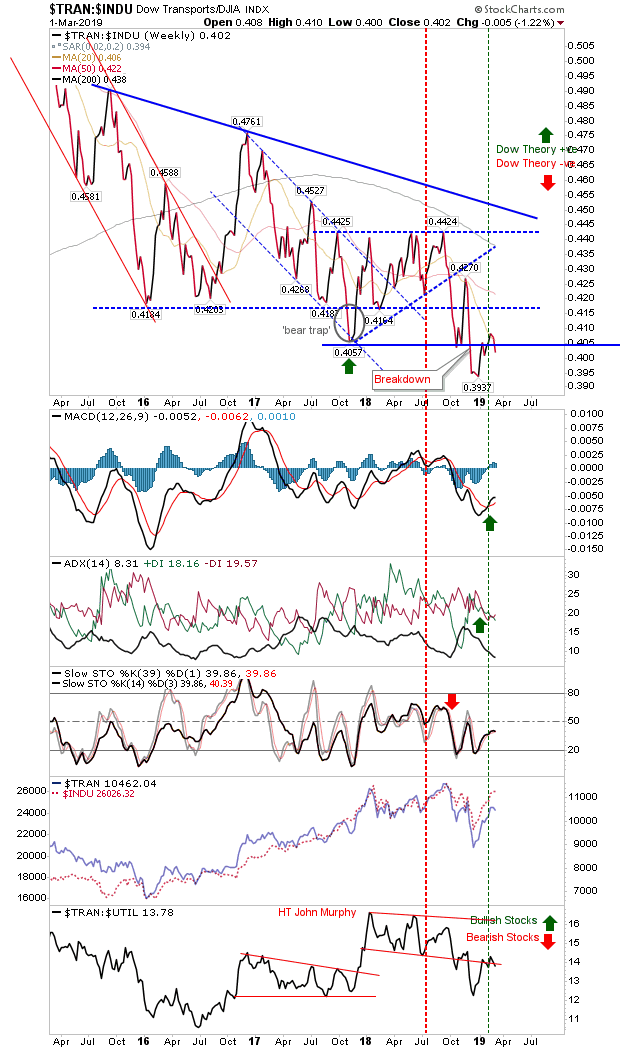
My Dow Theory indicator (relationship between Dow Jones Industrials and Dow Transports) has also taken a tick lower after yet another break of support. This indicator has been struggling since 2015. The relationship between Transports and Utilities looks also to have played out a recovery bounce and is now reversing from resistance. Both of these factors are bearish for the market.
So for today, the near-term remains favorable for the market but any undercut of last week's shallow pullback would be reason enough to take profits or at the least exit any recent long trades.
