🤯 Have you seen our AI stock pickers’ 2024 results? 84.62%! Grab November’s list now.Pick Stocks with AI

Market Prediction: The Reflation Trade Will Lead Stocks Higher In 2020

Published 12/26/2019, 12:16 AM
Updated 09/20/2023, 06:34 AM
XLB
-
XLE
-
XLF
-
XLI
-

2019 is coming a close, and now as we turn towards next year, I present to you stock market predictions for 2020.

Here are my predictions so far: with global growth returning, the U.S. economy will surge to a 3% growth rate, U.S. rates on the rise, the U.S. dollar will sink, inflation will return, and commodities prices will soar. Investors will also heavily rotate into a reflation trade meaning, materials, industrials, energy, and financials stock will be among the best performing sectors in 2020.

The Reflation Trade 2020

If 2019 was the year for taking on risk, then 2020 will be all about the reflation trade and cyclical stocks rising. That means that the industrials, materials, energy, and financials stocks will take some of that bite away from the Semiconductor, Technology, and Biotechnology group’s which soared in 2019.

Industrials (XLI)

The Industrials ETF (XLI) has already broken out, rising above a great level of technical resistance $80.75. The XLI ETF has been holding above support at $80.75 and is forming a bullish pattern known as a pennant. It means the sector is poised to rally in the weeks and months ahead, potentially by as much 15% to $93.25.
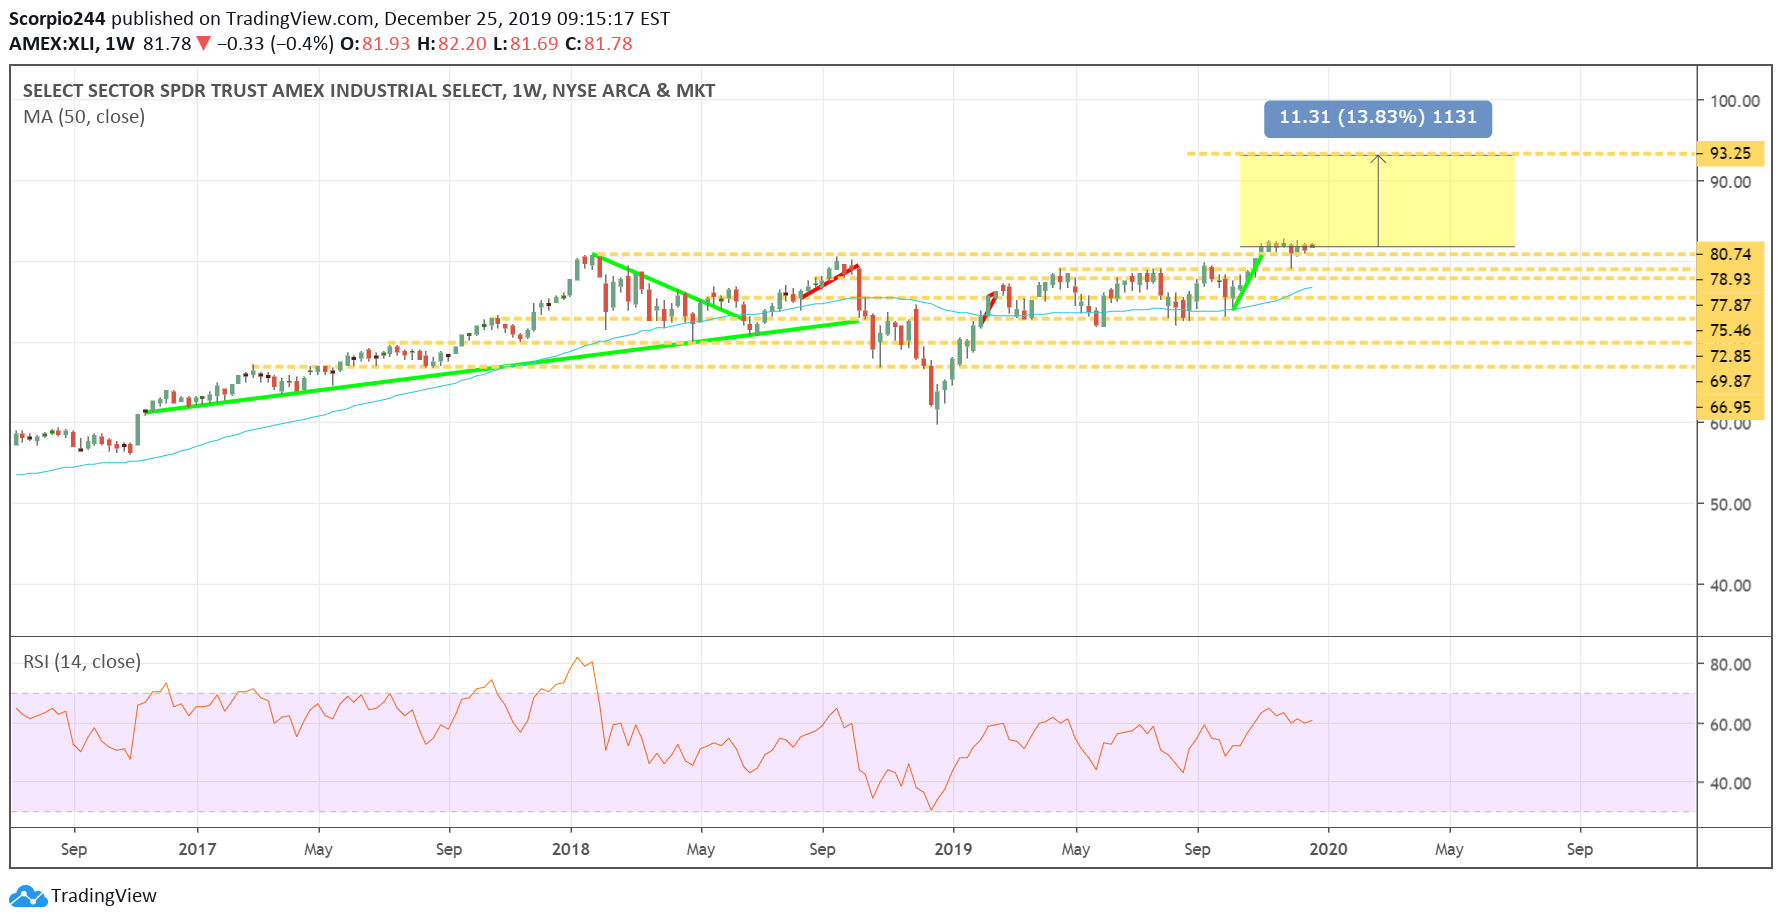
XLI Weekly Chart

Material (XLB)

The Materials ETF (XLB) is very close to first breaking out and that could send the ETF back to all-time highs around $64.20. However, the gains could grow much large should the ETF rise above $64.20, potentially rising to as high as $67.50, an increase of 11%
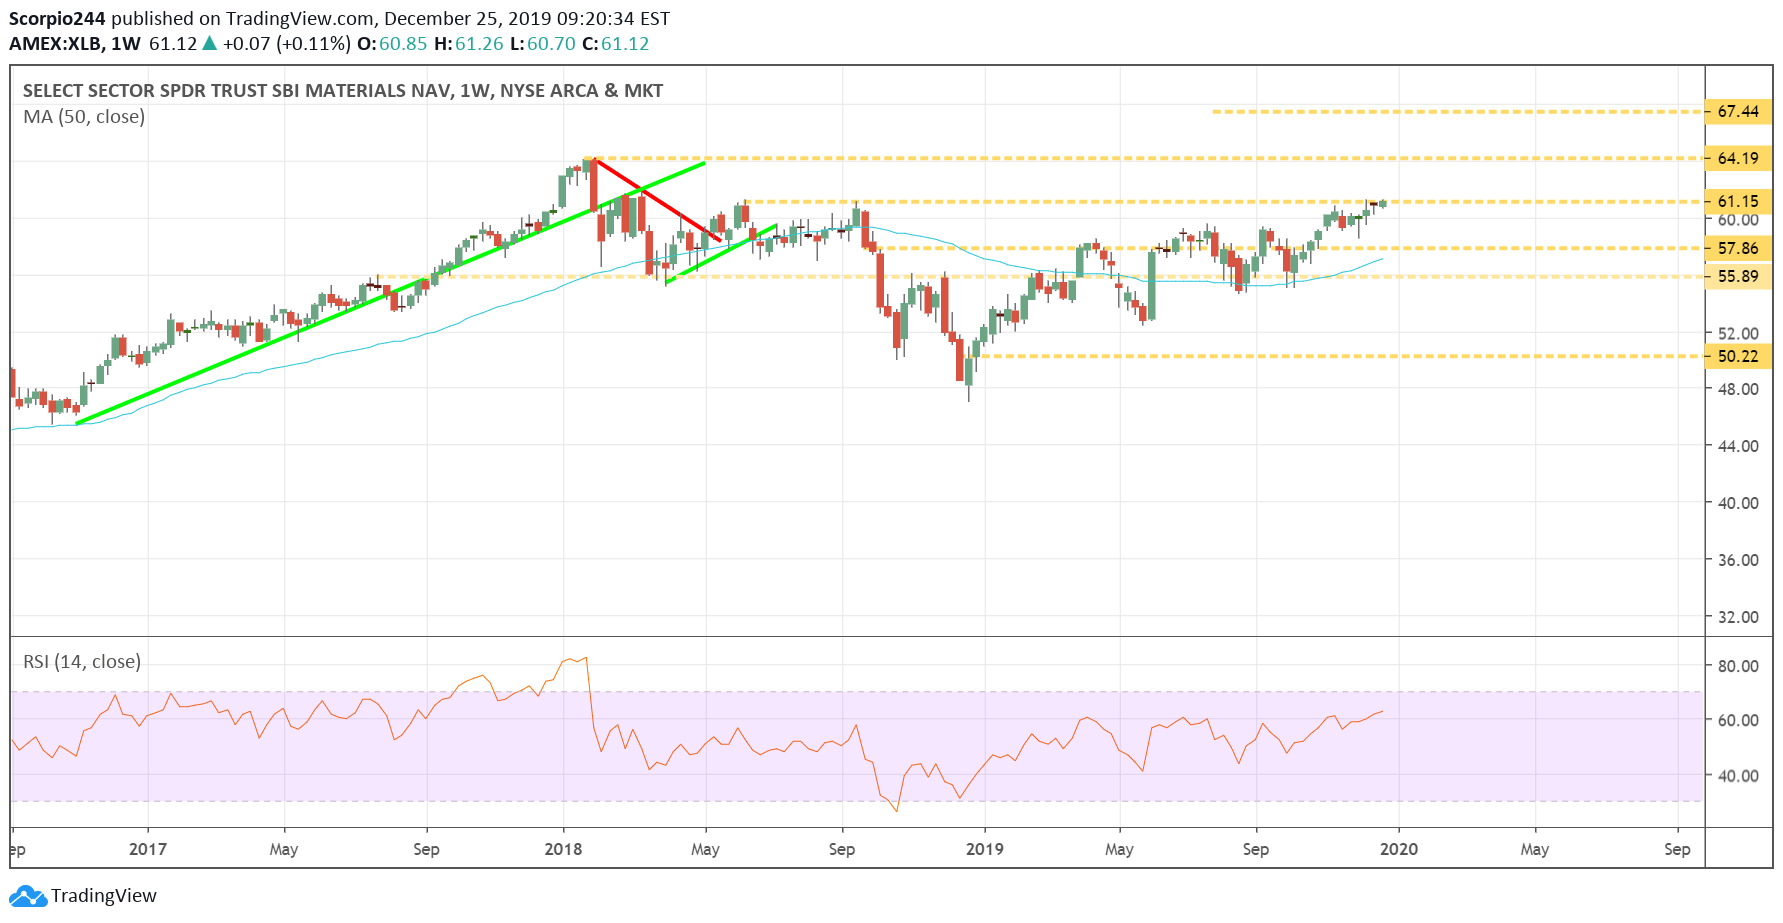
XLB Weekly Chart

Energy (XLE)

Meanwhile, the Energy ETF XLE is nearing a significant breakout of its own after it rising above two downtrends, and is now heading to resistance at $63.40. It could result in the ETF rising to around $68.90, a jump of almost 11.5%.
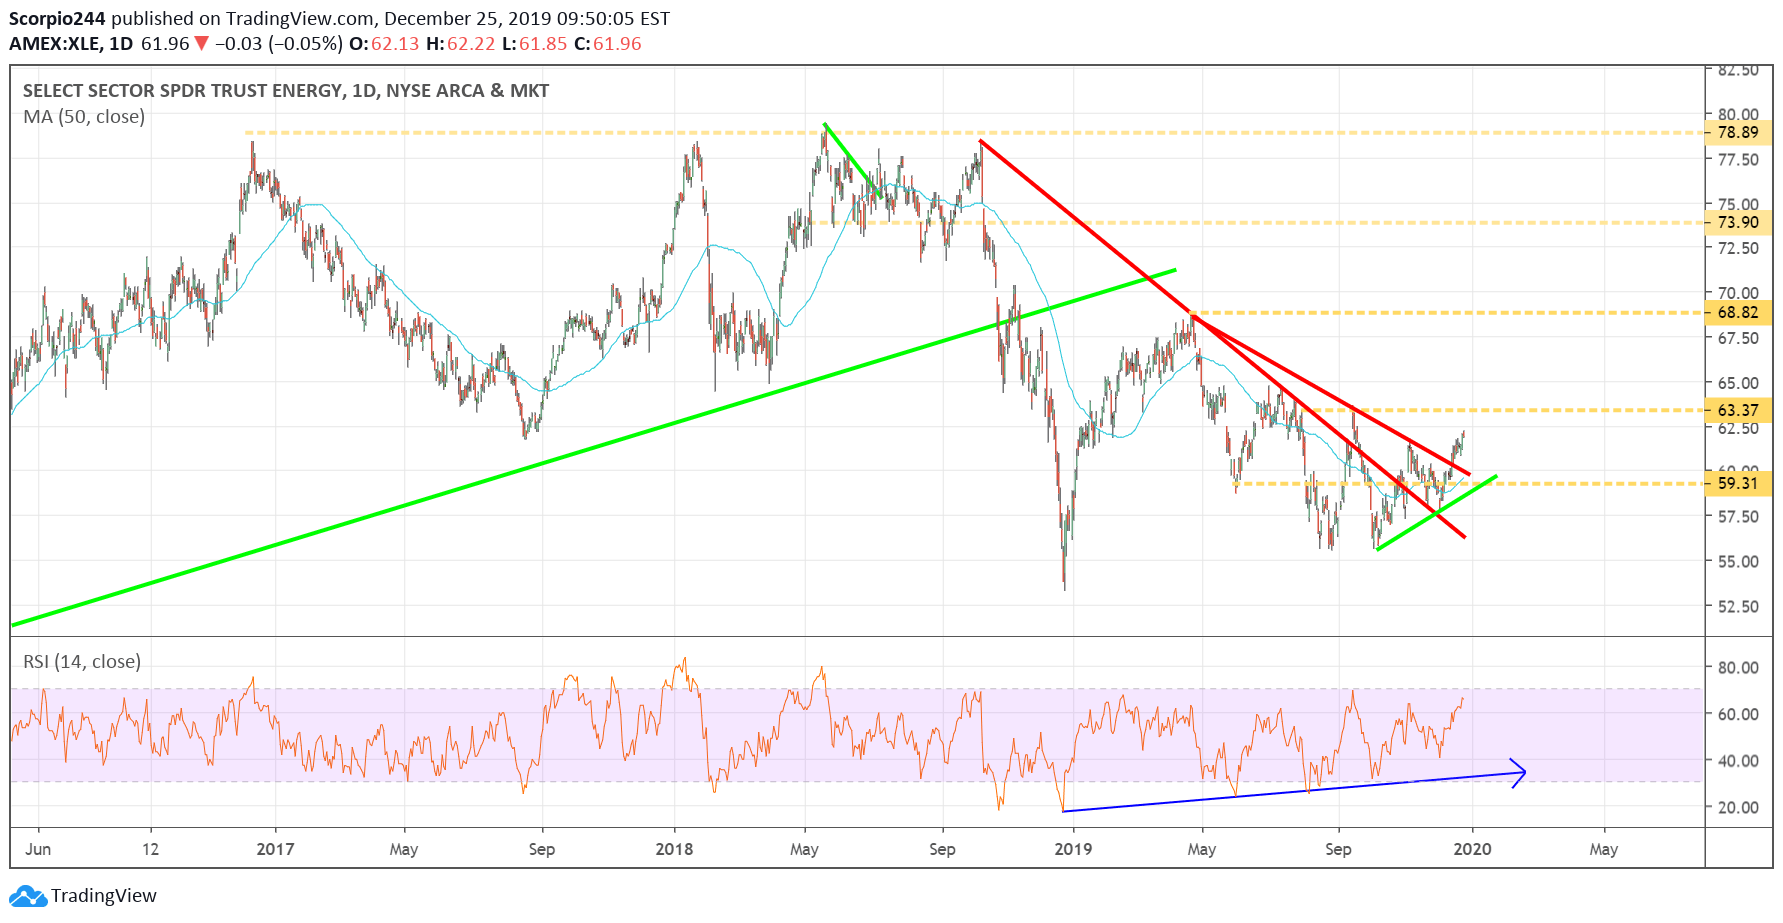
XLE Daily Chart

Financials (XLF)

Finally, rising yields and widening spreads will help to lift the bank stocks in 2020. The XLF ETF is at its highest level since 2008 and is on the verge of a massive break out should it rise above resistance at $31. It could result in the ETF rising to around $36.60, a gain of 17%.
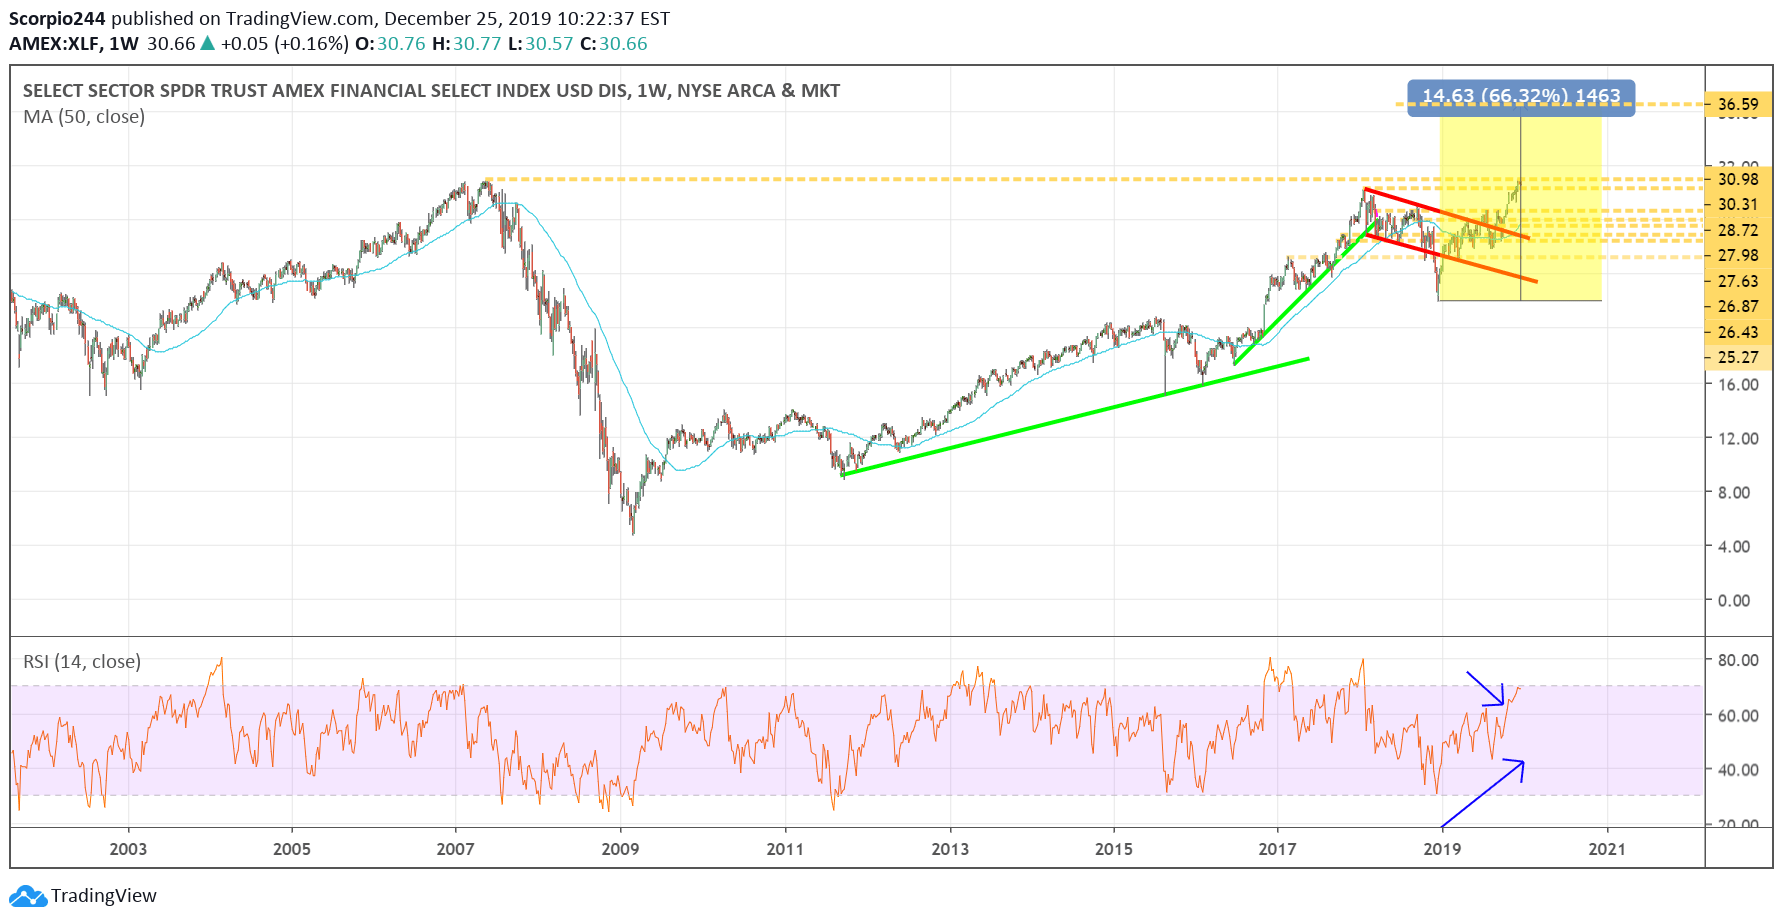
XLF Weekly Chart

It makes these four sectors the must-watch groups of 2020 and prediction 4 for 2020.

Original Post

Latest comments

Loading next article…
Risk Disclosure: Trading in financial instruments and/or cryptocurrencies involves high risks including the risk of losing some, or all, of your investment amount, and may not be suitable for all investors. Prices of cryptocurrencies are extremely volatile and may be affected by external factors such as financial, regulatory or political events. Trading on margin increases the financial risks.
Before deciding to trade in financial instrument or cryptocurrencies you should be fully informed of the risks and costs associated with trading the financial markets, carefully consider your investment objectives, level of experience, and risk appetite, and seek professional advice where needed.
Fusion Media would like to remind you that the data contained in this website is not necessarily real-time nor accurate. The data and prices on the website are not necessarily provided by any market or exchange, but may be provided by market makers, and so prices may not be accurate and may differ from the actual price at any given market, meaning prices are indicative and not appropriate for trading purposes. Fusion Media and any provider of the data contained in this website will not accept liability for any loss or damage as a result of your trading, or your reliance on the information contained within this website.
It is prohibited to use, store, reproduce, display, modify, transmit or distribute the data contained in this website without the explicit prior written permission of Fusion Media and/or the data provider. All intellectual property rights are reserved by the providers and/or the exchange providing the data contained in this website.
Fusion Media may be compensated by the advertisers that appear on the website, based on your interaction with the advertisements or advertisers.
© 2007-2024 - Fusion Media Limited. All Rights Reserved.