Low Volume Gains

Published 03/13/2016, 12:37 AM
Updated 07/09/2023, 06:31 AM
NDX
-
US500
-
DJI
-
US2000
-
IXIC
-
SOX
-

A brief update as work travel keeps me away from my blog. A strong finish to the end of week was tempered by the relatively light volume which came with the buying.

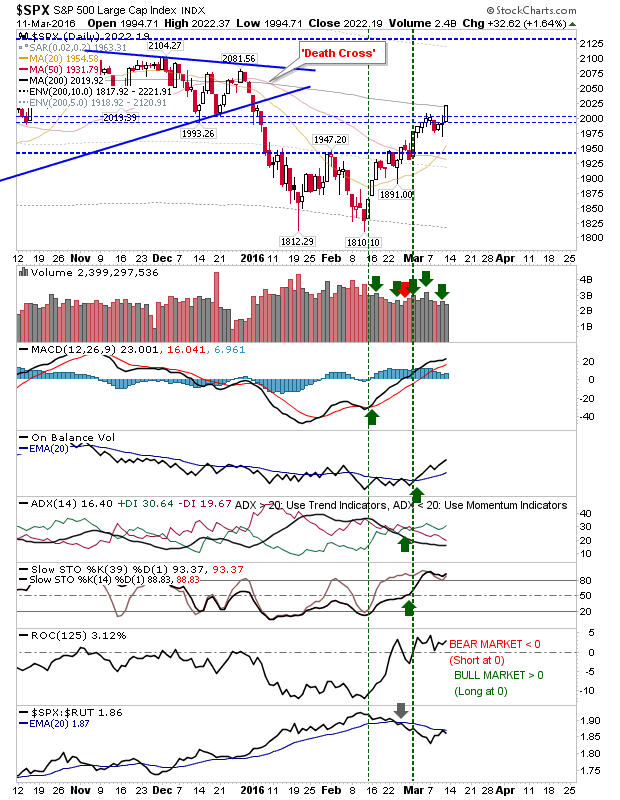
The S&P knocked on the door of the 200-day MA on solid technical strength. It will be important for buyers to keep buying pressure on as they look to push beyond and challenge 2015 highs. The index is also challenging relative performance gains as the maturing rally looks to see profit takers rotate out of speculative Small Caps into 'safer' Large Caps.

SPX Daily Chart

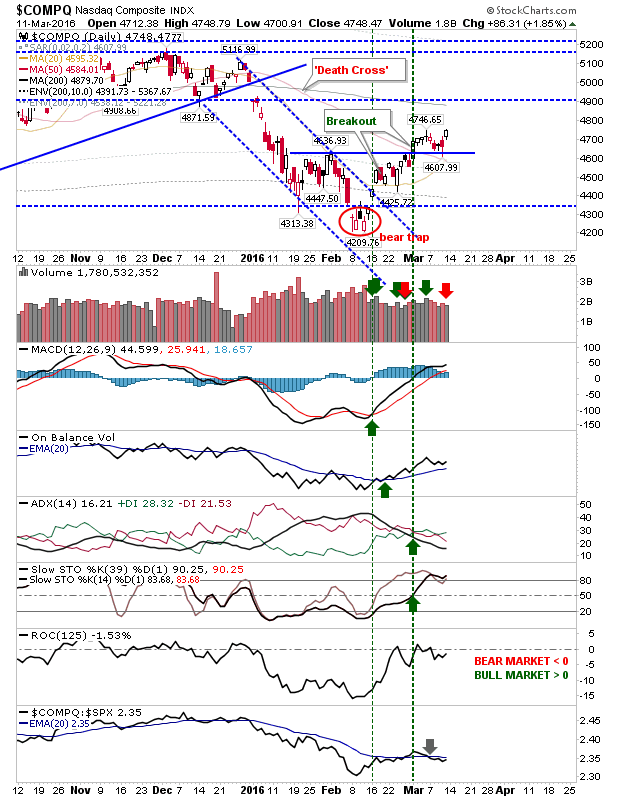
The Nasdaq managed a new swing high after a successful test of 4,535. It still has room to run before it gets to its 200-day MA. Tech averages have started to drift in technical strength, which may prove problematic if this trend continues for the coming weeks.

Nasdaq Composite Daily Chart


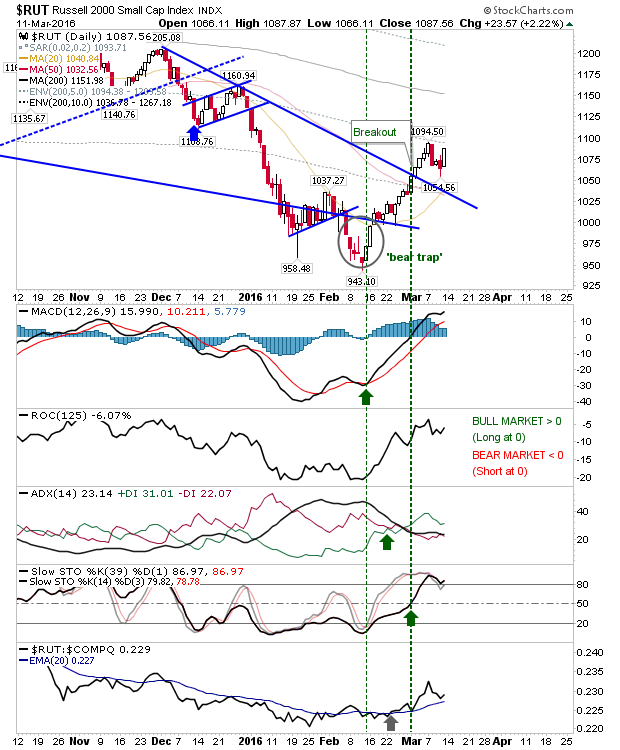
The Russell 2000 has enjoyed a solid advance from February lows with sharp outperformance against other indices. While latter strength has weakened, it's still on the positive side of the 20-day MA. Friday was one of the best for indices, but it still has plenty of room to run before it gets to the 200-day MA.

Russell 2000 Daily Chart


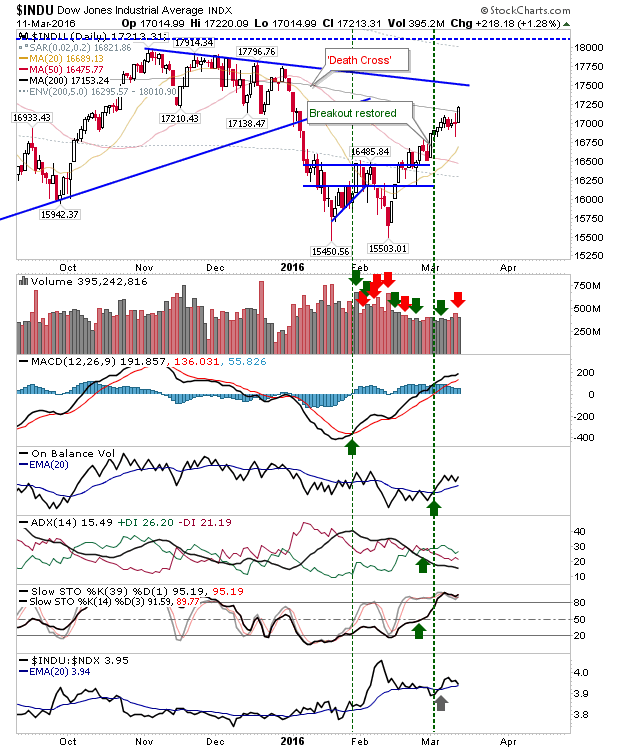
The Dow was able to inch above its 200-day MA as relative performance starts to drift lower. It could be the first index to test declining resistance from 2015 highs.

Dow Daily Chart


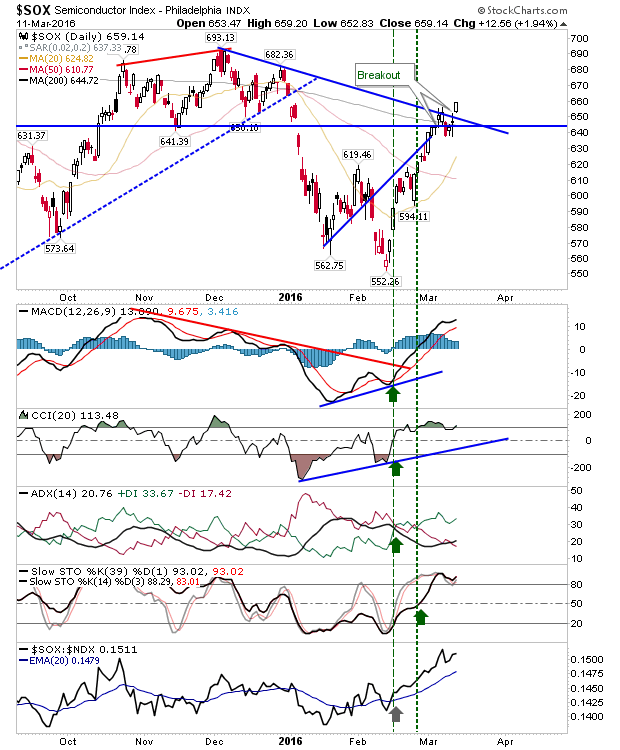
Good news for Tech indices is the breakout in Semiconductors. It has surpassed declining resistance from December highs, and is trading above its 200-day MA. This should help Tech indices continue their rallies.

SOX Daily Chart


Nasdaq Sectorbreadth has seen increased strength and resistance breaks for the Summation Index and the Percentage of Nasdaq Stock Above the 50-day MA. Bulls can look to these breaks as follow through opportunities for the Nasdaq and Nasdaq 100.
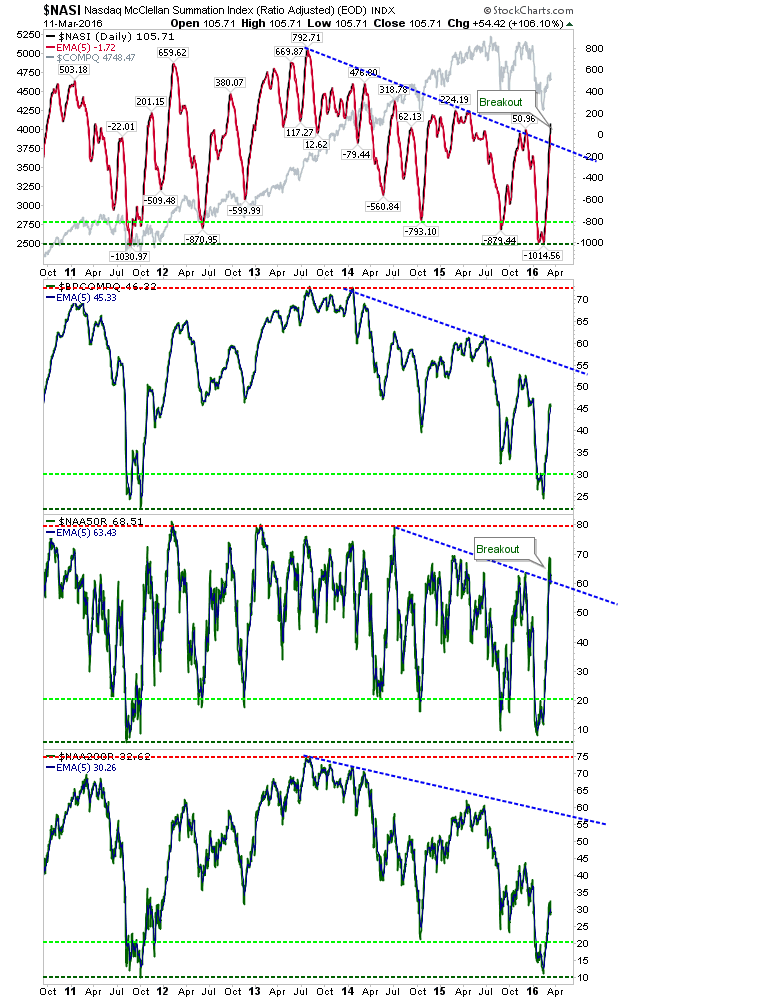
Nasdaq Daily Chart

Important times for the indices. Getting back to 2015 levels will effectively treat the 2016 sell off as an extreme bullish consolidation, which at the time had looked like anything but. If this is the case it would make the 2009/16 rally extremely long in the tooth, and a 40%+ trim from highs could not be ruled out sooner rather than later.

Latest comments

Loading next article…
Risk Disclosure: Trading in financial instruments and/or cryptocurrencies involves high risks including the risk of losing some, or all, of your investment amount, and may not be suitable for all investors. Prices of cryptocurrencies are extremely volatile and may be affected by external factors such as financial, regulatory or political events. Trading on margin increases the financial risks.
Before deciding to trade in financial instrument or cryptocurrencies you should be fully informed of the risks and costs associated with trading the financial markets, carefully consider your investment objectives, level of experience, and risk appetite, and seek professional advice where needed.
Fusion Media would like to remind you that the data contained in this website is not necessarily real-time nor accurate. The data and prices on the website are not necessarily provided by any market or exchange, but may be provided by market makers, and so prices may not be accurate and may differ from the actual price at any given market, meaning prices are indicative and not appropriate for trading purposes. Fusion Media and any provider of the data contained in this website will not accept liability for any loss or damage as a result of your trading, or your reliance on the information contained within this website.
It is prohibited to use, store, reproduce, display, modify, transmit or distribute the data contained in this website without the explicit prior written permission of Fusion Media and/or the data provider. All intellectual property rights are reserved by the providers and/or the exchange providing the data contained in this website.
Fusion Media may be compensated by the advertisers that appear on the website, based on your interaction with the advertisements or advertisers.
© 2007-2025 - Fusion Media Limited. All Rights Reserved.