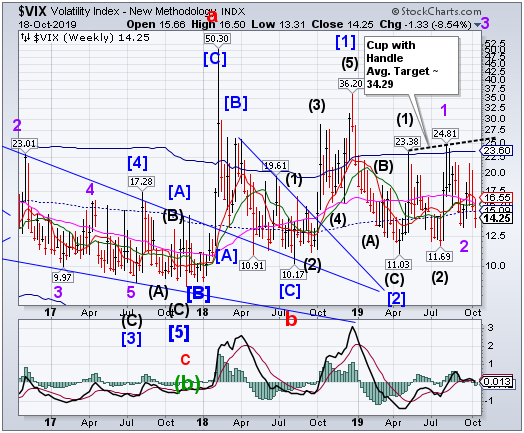
VIX pulled back beneath mid-Cycle support at 15.09 but did not go beneath the mid-September low.Crossing back above the mid-Cycle or Long-term resistance at 15.83 puts VIX back on a buy signal.Things can happen quickly and violently above these levels.
(ZeroHedge) If one observes a conventional indicator of prevailing risk sentiment such as the VIX, which is trading in the low teens and near the lowest levels over the past two years (and far below its long-term average of 20), one would be left with the impression that virtually nothing is keeping Wall Street up at night.
On the other hand, an even cursory assessment of current events - where in addition to trade war, slowing economies, renewed easing (there have been 54 global rate cuts YTD), repo market instability, an earnings recession, rising wages and shrinking margins, the world's most powerful person is now facing impeachment - would suggest that something is about about to snap, a conclusion which was confirmed by today's shocking surge in the US economic policy uncertainty index, which bizarrely hit an all-time high.
SPX rallies inside the Diamond formation.
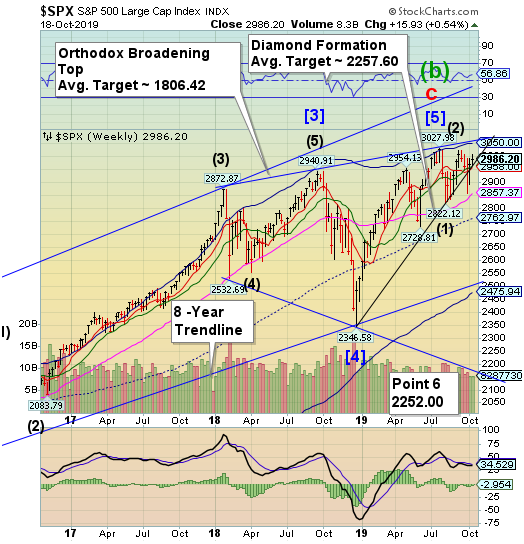
SPX rallied to a high of 3008.29, but could not establish a new high.However, a decline beneath the trendline of the Diamond formation and Intermediate-term support at 2959.40 reinstates the sell signal Bearish back tests may enter the Diamond formation. However, a breakdown beneath the trendlin may lead to a flash crash with a similar target as “Point 6” of the Orthodox Broadening Top. The Cycles Model suggests a rapid decline ahead. Prepare for another potential “limit down” next week.
(CNBC) Wall Street fell on Friday, dragged down by Boeing (NYSE:BA) and Johnson & Johnson (NYSE:JNJ) and as worries over global economic growth were rekindled by gloomy data out of China.
The world’s second-largest economy expanded at its weakest pace in almost 30 years in the third quarter amid a bitter trade war with the United States, which has roiled financial markets and fueled fears of a global recession.
NDX closes above the Diamond Trendline.
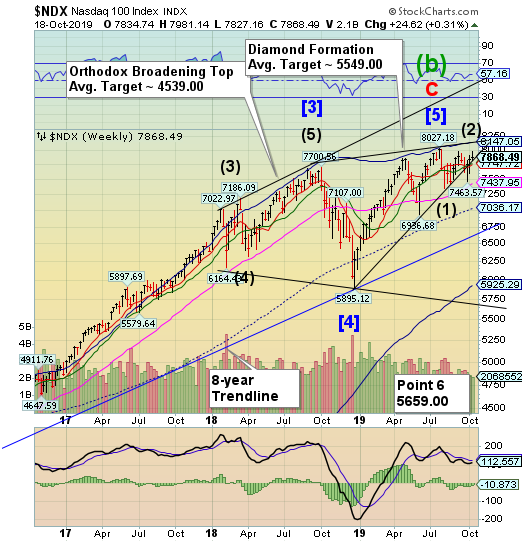
NDX made a marginal new high above the September peak, then tested the Diamond trendline at 7830.00, closing above it. This action does not nullify the Diamond formation.Its target agrees with “Point 6” of the massive Orthodox Broadening Top formation. We seldom have multiple confirmations of the general market direction, but in this case it should put us on high alert for a decline beneath the lower Diamond trendline at 7730.00 for a confirmed sell signal.
(ZeroHedge) It will hardly come as a surprise to many, but according to the latest cash flow analysis from Goldman Sachs (NYSE:GS), 2018 was a record year for S&P 500 cash spending: not only did aggregate spending on capex, R&D, cash acquisitions, dividends, and share repurchases rose by 25% to $2.8 trillion, "the fastest year/year growth in 30 years"...
... but more notably, for the first time since the financial crisis, companies spent more on dividends and buybacks than they generated in free cash flow to wit: "share repurchases surged by 54% to $833 billion and for the first time in the post-crisis period net buybacks and dividends during 2018 totaled more than 100% of free cash flow."
High Yield Bond Index repelled at Long-term resistance.
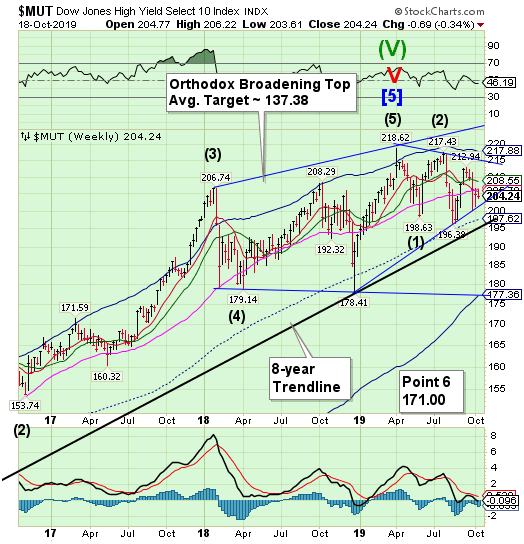
The High Yield Bond Index was repelled at Long-term resistance at 206.53.The sell signal is confirmed with the Diamond Formation trendline being the trigger for a larger decline. The Cycles Model warns the next step down may be a large one.
(CIO) Looking for impending trouble in the economy? There’s a new worry: Junk bonds, which suffer the most in a recession, are looking at a surge in credit-rating downgrades vs. upgrades.
According to Moody’s Analytics, the ratio of high-yield downgrades to upgrades has doubled—to 2.38:1 for January-September 2019, from 1.09:1 for calendar 2018. A revenue fall is to blame.
“A pronounced slowing by business sales, both with and excluding energy products, helps to the explain the marked excess of high-yield downgrades over upgrades after omitting primarily event-driven rating changes,” wrote John Lonski, the organization’s chief economist.
Treasuries on a sell signal.
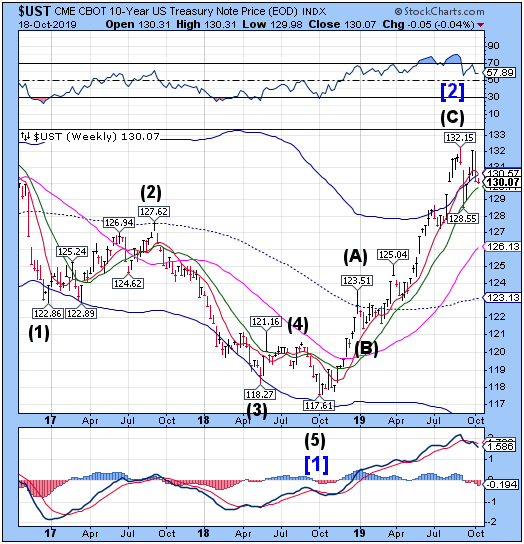
The 10-year Treasury Note declined to a potential Master Cycle low on Tuesday. There is room for a short-term rally in the Cycles Model in the next week, but investors may wish to sell the bounce. It appears that the UST Cycle is lining up with the equities Cycle and this rally may be a trap for unwary investors.The Cycles Model suggests the decline may resume through the end of the year.
(ZeroHedge) In the past month, a feud has erupted in the financial media and across capital markets between defenders of the Fed, who praise the return of its unprecedented easing in the form of $60BN in monthly T-Bill purchases, by refusing to call it by its real name, and instead the Fed's fan club calls it "not QE" (just so it doesn't appear that ten years after the Fed first launched QE, we are back to square one), and those who happen to be intellectually honest, and call the largest permanent expansion in the Fed's balance sheet, meant to ease financial conditions and boost liquidity across the financial sector, for what it is: QE.
It is this same "not QE" that has boosted the Fed's balance sheet by $200BN in one month, the fastest rate of increase since the financial crisis.
The Euro challenges Intermediate-term resistance.
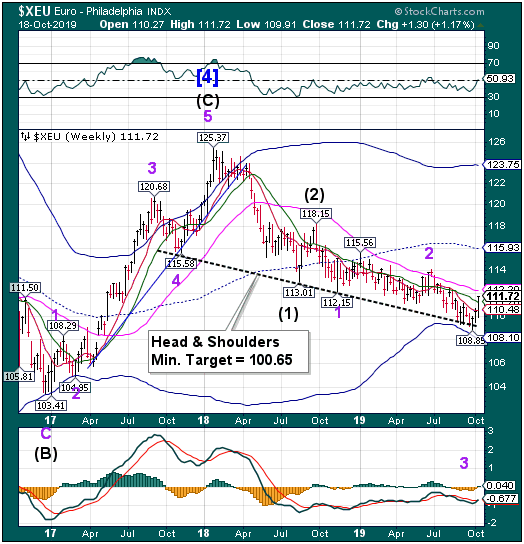
The Euro continued its rally, challenging Intermediate-term resistance at 111.20.The sell signal may be suspended, pending the coming week activities. Returning beneath Intermediate-term resistance reinstates the sell signal.The Cycles Model suggests a period of weakness stretching through the end of October.
(Bloomberg) The euro’s rally may have further to run with the shared currency likely to find support from a range of factors after uncertainty over Brexit clears.
The common currency touched its strongest level in seven weeks on Thursday after the U.K. and the European Union reached a deal on Brexit. While British lawmakers could reject the pact on Saturday, the possibility of increased government spending in Europe and further U.S. interest-rate cuts may help keep wind in the euro’s sails.
EuroStoxx reaches a new retracement high.
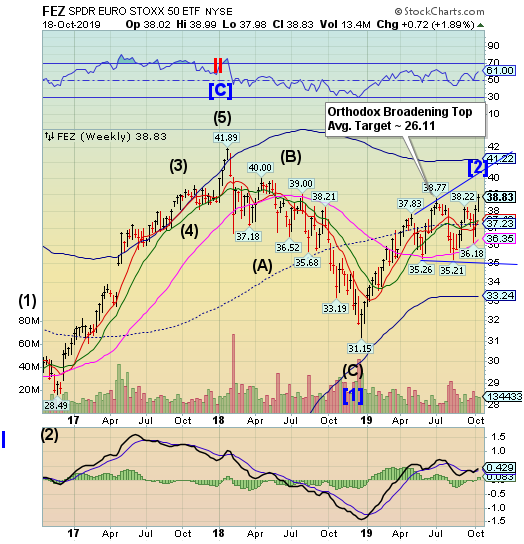
Note: StockCharts.com is not displaying the Euro Stoxx 50 Index at this time.
The EuroStoxx50 SPDR rallied to a new retracement high on Thursday.But don’t be mistaken. This is not bullish..The Cycles Model suggests a probable decline through the end of October.
(CNBC) European stocks closed lower Friday afternoon as traders await signals as to whether a Brexit deal agreed between the U.K. and EU will pass muster with British lawmakers in parliament.
The pan-European Stoxx 600 ended provisionally lower by 1.15%, with autos trading down 1.45 % on the back of a profit warning from Renault (PA:RENA), while basic resources added 0.33%.
U.K. Prime Minister Boris Johnson agreed a new Brexit deal which was unanimously backed by European Union leaders on Thursday, but must now fight to secure approval from British MPs (Members of Parliament) in a vote on Saturday if he is to succeed in taking Britain out of the bloc on October 31.
The Yen bounces from a Master Cycle low.
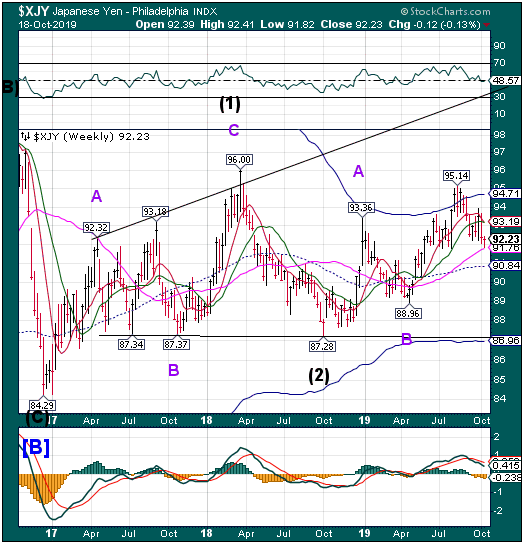
The Yen bounced from Long-term support on Tuesday. It has been a longer than usual shakeout, but may now support a resumption of the rally through late November.
FinancialTimes writes, “There is a $1.5tn reason for the yen not moving higher”
Nikkei slammed beneath mid-Cycle support.
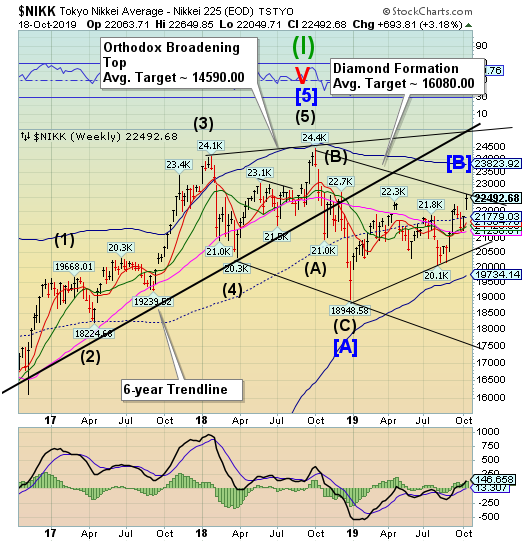
The Nikkei Index broke above a 9-month sideways consolidation, but may have hit a Master Cycle high in the process.A reversal from here may produce a sell signal beneath mid-Cycle support at 21779.03. The subsequent decline may last through early December,according to the Cycles Model.
(InvestingCube) Asian indices ended mixed today as investors closely follow the developments around the Brexit agreement. Confusing headlines over trade deal between China and the USA weigh on investors sentiment. The Hang Seng index finished 0.55% lower at 26,706, the Shanghai Composite ended 1.32% lower at 2,938, while the Singapore Straits Times is 0.37% lower at 3,11. Aussie stocks also finished lower; the ASX 200 ended 0.52% lower at 6,649.
Nikkei 225 finished 0.18% higher at 22,492 as the index consolidates around yearly highs after encouraging earnings from USA. Data from China disappointed investors as Gross Domestic Product (YoY) below came in at 6% below expectations of 6.1% in 3Q, for the quarter China Gross Domestic Product came in at 1.5% in line with forecasts.
U.S. Dollar falls short of a new high.
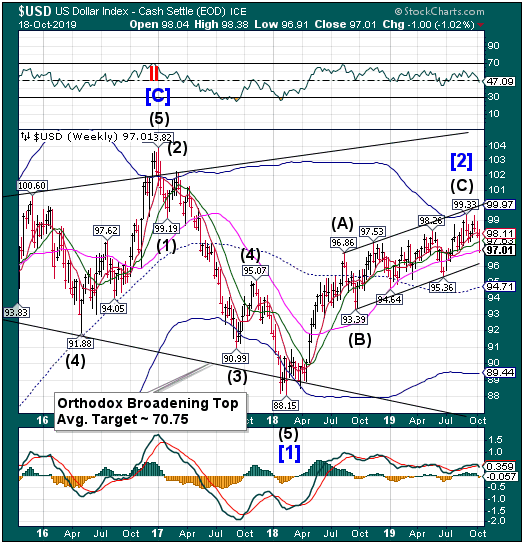
USD declined to close beneath Long-term support at 97.05. We may see the USD continue its decline through the end of October. Something is amiss, but no one is telling.
(ZeroHedge) Just hours after the Fed announce that it accepted $56.65BN in collateral in its latest overnight repo operation ($47.95BN in TSYs, $8.2BN in MBS), which was a modest decline from Thursday's operation, which as we noted at the time was on the verge of being oversubscribed...
... the Fed announced the results of its second "NOT A QE" Treasury-Bill POMO, which showed that Dealers submitted $36BN in bids for the maximum $7.5BN in purchases.
As such, the operation was 4.8x oversubscribed, a notable increase from the first POMO conducted on Wednesday when Dealers indicated they wanted to purchase $32.6BN in Treasuries, or "only" 4.3x oversubscribed.
Gold bounces at Cycle Top support…again.
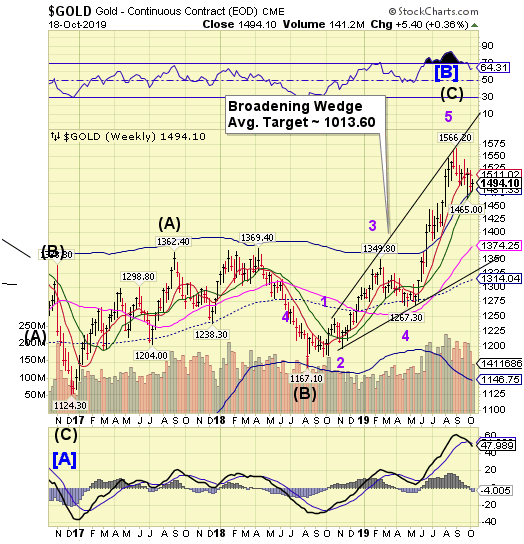
Gold appears to be creeping up Cycle Top support at 1481.33, which is construed by many to be bullish. Gold is currently on a sell signal beneath Short-term resistance at 1511.02. However, a rally above Short-term resistance may propel gold toward 1600.00 over the next 2-3 weeks.
(FXEmpire) Gold has been consolidating for about 6-week after peaking in September. The COT report remains near-term bearish with commercial shorts just off record levels – it will take time to work down those positions. The next buying opportunity in gold may not arrive until November. I have a minimum target of $1410 – $1420 and see the potential for a back test of the June $1380 breakout area.
AG Thorson is a registered CMT and expert in technical analysis. He believes we are in the final stages of a global debt super-cycle. For more information, please visit https://goldpredict.com/
Crude consolidates above the trendline.
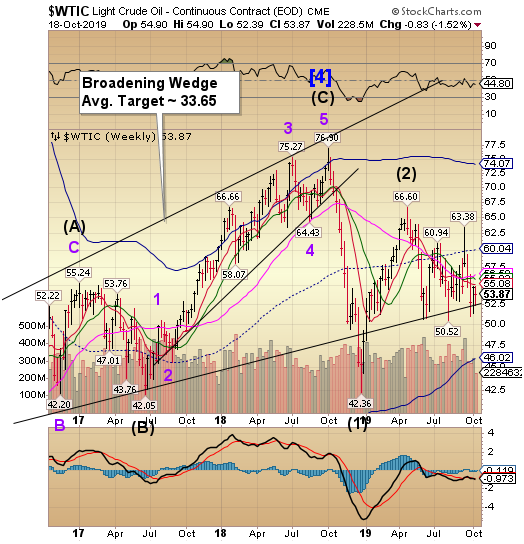
West Texas Crude continued its consolidation above the Broadening Wedge trendline. It may have a very short period of strength to complete the consolidation. The Cycles Model suggests that the decline may resume through the end of November.
(OilPrice) The world’s largest oilfield services provider, Schlumberger (NYSE:SLB), reported on Friday a net loss of US$11.38 billion for the third quarter, compared to a US$644-million profit for Q3 2018, after a hefty pretax charge of US$12.7 billion weighed on the most recently reported results.
The pretax charge, driven by market conditions, is almost entirely non-cash and primarily relates to goodwill, intangible assets, and fixed assets, said Schlumberger (NYSE:SLB), which also flagged continued slowdown in North America’s drilling growth.
The slowdown resulted in an 11-percent yearly decline in North American revenue for Schlumberger (NYSE:SLB). North American revenue dropped to US$2.85 billion in the third quarter of 2019 from US$3.189 billion in the same period of 2018.
Agriculture Prices break out of the consolidation.
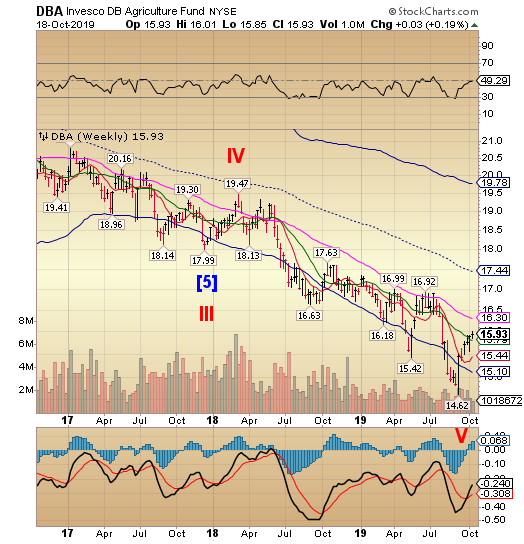
Note: The Bloomberg Agricultural Sub index has gone dark. We will be using DBA as a proxy for agricultural prices. DBA consolidated this week after nearly a 9% rally since early September. The Cycles Model suggests a continued rally through late November, possibly longer. The rally is still early in its formation.
(ZeroHedge) An unprecedented October blizzard that hit just before harvest time has absolutely devastated farms all across the U.S. heartland.
As you will see below, one state lawmaker in North Dakota is saying that the crop losses will be “as devastating as we’ve ever seen”. This is the exact scenario that I have been warning about for months, and now it has materialized. Due to endless rain and horrific flooding early in the year, many farmers in the middle of the country faced very serious delays in getting their crops planted. So we really needed good weather at the end of the season so that the crops could mature and be harvested in time, and that did not happen. Instead, the historic blizzard that we just witnessed dumped up to 2 feet of snow from Colorado to Minnesota. In fact, one city in North Dakota actually got 30 inches of snow. In the end, this is going to go down as one of the worst crop disasters that the Midwest has ever seen, and ultimately this crisis is going to affect all of us.
Shanghai Index repulsed at mid-Cycle resistance.
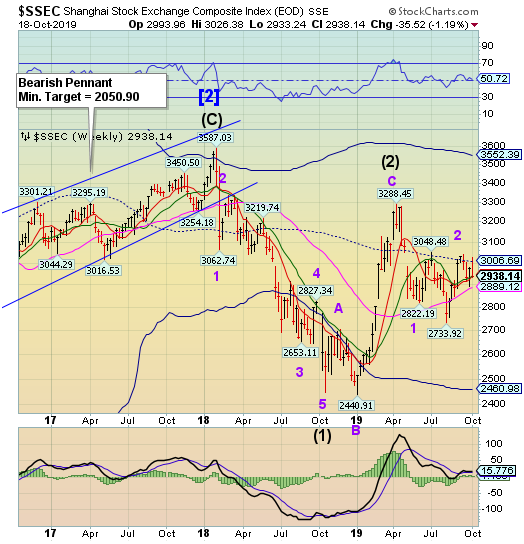
The Shanghai Index tested mid-Cycle resistance at 3006.69 on Monday, then declined to Intermediate-term support at 2936.62, closing above it for the week.There is a potential sell signal beneath that level. The Cycles Model suggests potential 7 weeks of decline
(ZeroHedge) China ramped up Soybean purchases from Brazil last week, despite President Trump showboating a potential $50 billion agriculture deal with Beijing.
Multiple traders told Reuters that Brazilian soybeans are more appealing to commercial importers, especially ones from China, who are looking for deep discounts.
As of last week, Beijing hasn't lifted 25% tariffs on US soybeans nor granted new waivers to state-owned businesses, indicating that China isn't ready to buy US agriculture products, as of late October.
China typically sources most of its soybeans from the US between October and January, then from South American countries in early 1Q. But this year, according to traders, as the trade war continues to escalate to the point of return, China is abandoning US markets despite positive sentiment from President Trump's tweets.
The Banking Index rises to the upper Diamond trendline.
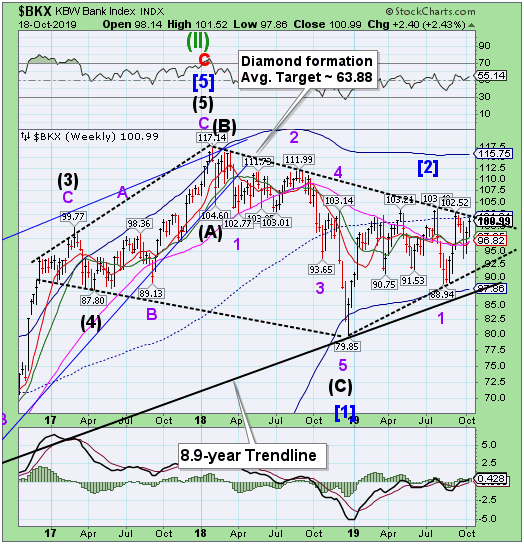
BKX is testing the upper Diamond formation trendline again. The Cycles Model suggests the peak was on Wednesday.If so, the decline from here may be profound.
(Bloomberg) China’s base rate for new corporate loans stayed unchanged in October, defying expectations of a reduction as the economy sees its slowest pace of growth since the early 1990s.
The one-year loan prime rate was kept at 4.2%, according to a statement from the central bank on Monday. That compares to the 4.15% median estimate compiled by Bloomberg. The five-year tenor was also kept unchanged at 4.85%.
(ZeroHedge) With the IMF's annual meeting now concluded, few topics discussed during the past week which saw the IMF downgrade its outlook for the global economy to the lowest GDP since the global financial crisis...
... evinced as powerful a response as negative interest rates, and for good reason: long seen as the last "red line" of central banks before they are forced to admit defeat, some $15 trillion in debt now trades with a negative yield, making a farce of conventional finance which operates on the simple premise of "time value of money", which has been flipped on its head, as negative rates mean that the value of money is now negative.
Meanwhile, with the ECB recently cutting rates further into negative territory, and the BOJ likewise set for even more negative rates, a rare public debate among establishment economists has erupted as a growing number of policymakers question the value of its deep foray into unconventional monetary policy. Just one month ago, Dutch Central Bank chief, a frequent critic of the bank’s ultra-easy monetary policy, unloaded on ECB outgoing president Mario Draghi: "This broad package of measures, in particular restarting the asset purchase program, is disproportionate to the present economic conditions, and there are sound reasons to doubt its effectiveness. There are increasing signs of scarcity of low-risk assets, distorted pricing in financial markets and excessive risk-seeking behaviour in the housing markets."
