While today ended as a day for bulls to take satisfaction, there is still plenty of work to do to get indices back to the multi-year highs which were challenged last week. The losses endured on Friday and Monday were enough to drive technical breaks, but not all of these were undone by today's buying.
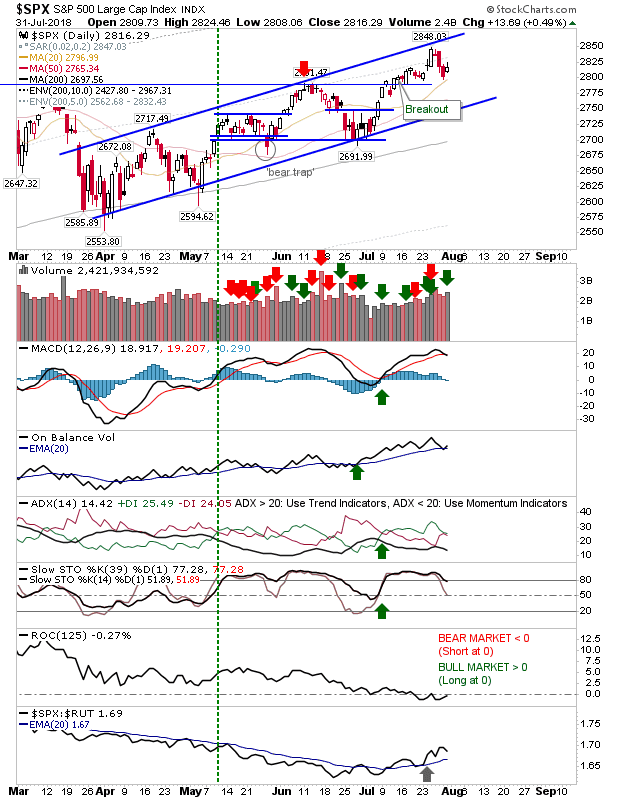
The S&P 500 managed to retain its breakout as buyers looked to defend its 50-day MA. Volume climbed to register an accumulation day as supporting technicals remained in the green.
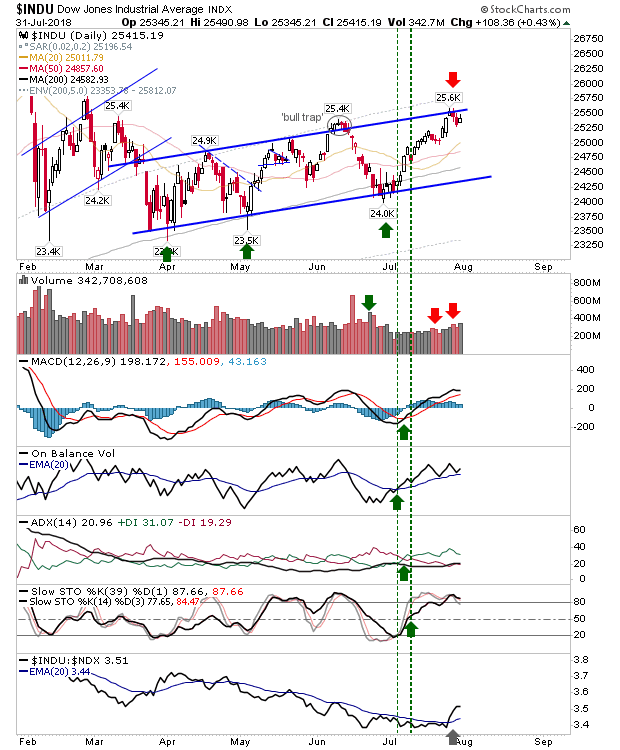
The Dow Jones Industrial Average had been working through its supply issues in what has been a very scrappy six month period. Watch for an upside break of the channel although a move to the lower channel is still looking more likely at this stage.
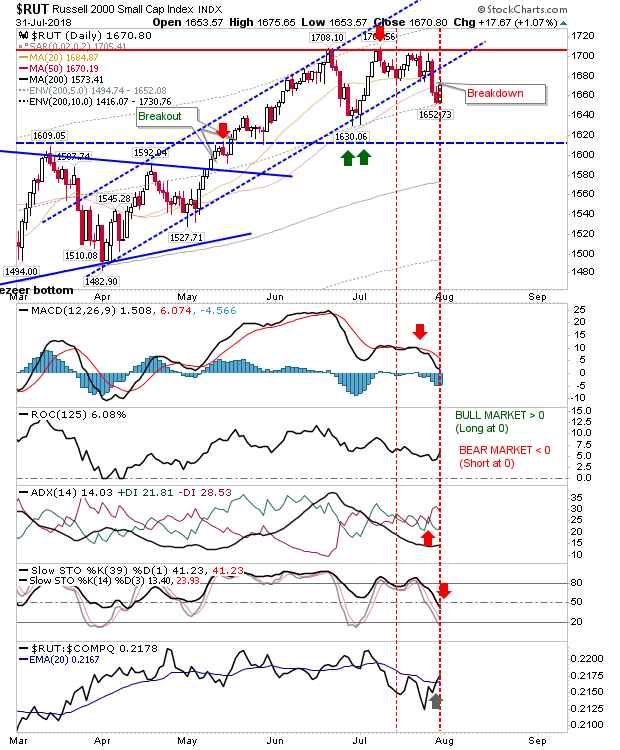
Small Caps had a very good day, but there is much lost ground still to make up. The worrying development was the channel breakdown on Friday, but if it can break above 1,710 it would reaffirm the bullish trend established since May. Technicals are now considered net bearish with the loss of the bullish mid-line for slow stochastics [39,1].
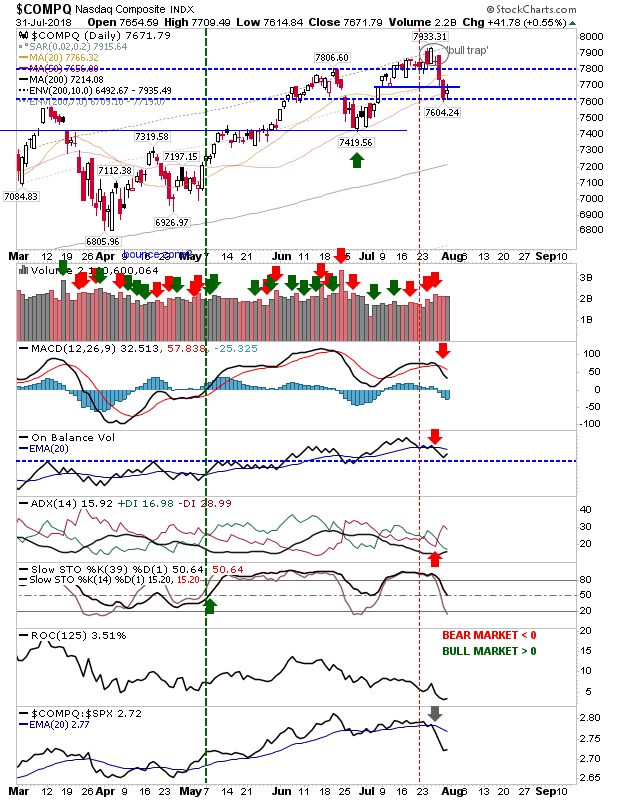
The Nasdaq has been working its 50-day MA for the second time since its last successful test in June. Today's action can be read as a bullish harami, which means bulls can buy with a stop on a loss of 7,605. The initial target is to recover 7,800 and challenge the 'bull trap'.
The worry is the Philadelphia Semiconductor Index. After doing well to break 1,380 it now finds itself again on a bearish foot following a fresh 'bull trap'. It may drift down to its 200-day MA (yet again) but each such test increases the chances for a breakdown. While the index has yet to establish a new trend as it works through its consolidation a triangle, a new downtrend would be bad news for the Nasdaq and Nasdaq 100 (and eventually Large and Small Cap indices too).
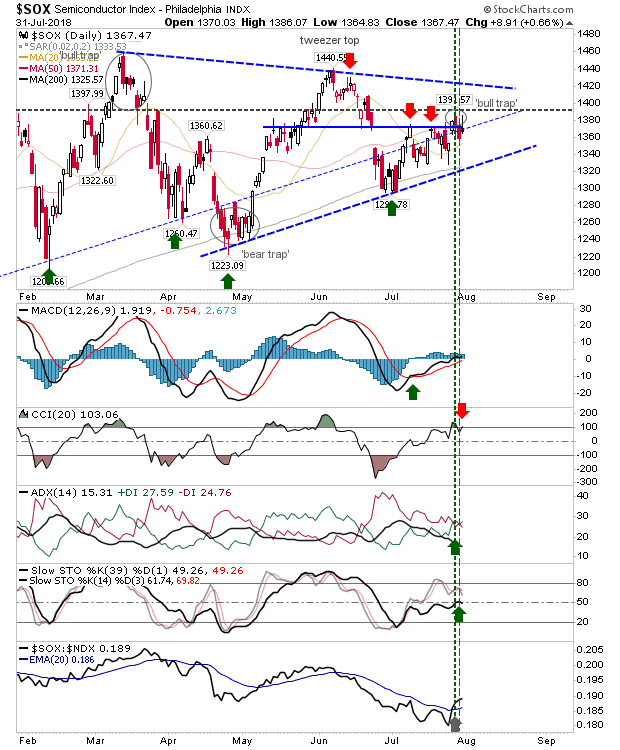
For tomorrow, all eyes should be on the Semiconductor Index. It does look like this index is on the cusp of a new bear trend which will have negative effects for all the indices. We may be looking at a winter of discontent as profit takers take money off the table on the post-Trump election surge. If you are a long-term investor, wait for markets to become oversold by the metrics I track and display in the tables at the end of this post before committing money. If you are a short-term bull, stay on the sidelines. Meanwhile, shorts can look to build positions.
