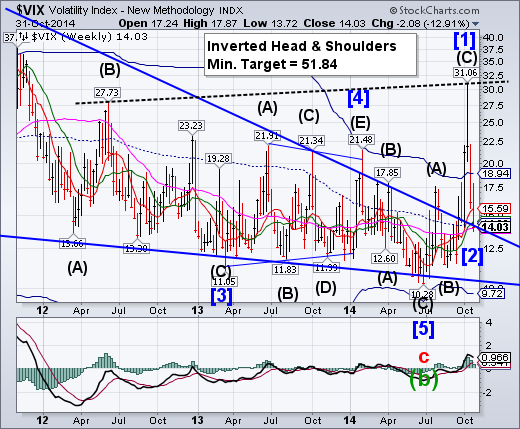
-- VIX closed at the upper trendline of its Ending Diagonal and just beneath its mid-cycle support/resistance at 14.33.Coming up next is a Primary Wave [3] which may meet or exceed the Head & Shoulders target listed on the chart.
S&P 500 stops at its Ending Diagonal trendline.
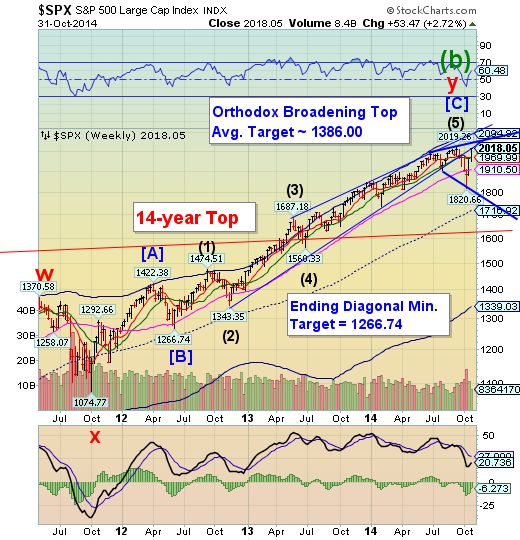
SPX hit overhead resistance at its Ending diagonal trendline this week, preventing it from makig a new (intraday) high.This week’s action may have created a new, larger Orthodox Broadening Top than previously shown. Although not confirmed, the new megaphone formation carries a much more bearish potential. Unfortunately, most investors will be unaware of this probability.
(CNNMoney) Who needs candy on Halloween when the stock market is giving out such big treats.Take a look at the headline numbers: The S&P 500 is now up 9% for the year. No, that's not the 30% gain we saw in 2013, but it's still very solid.Those who stayed in the market despite the turmoil earlier in the month are having an extra Happy Halloween.The NASDAQ is up nearly 11% for the year, and the Dow is almost 5% higher.
This October rebound has been so sweet that the Dow and S&P 500 both closed at record highs (17,390 for the Dow and 2,018 for the S&P 500). The Nasdaq didn't set a record today, but it's at its highest point other than the March 2000 Dot-Com peak.
Like the house that gives out the giant candy bars to trick-or-treaters, the Bank of Japangave the market an extra large boost Friday by announcing additional stimulus measures. The move was unexpected, and markets around the world are surging on the news.
NDX reaches a new high.
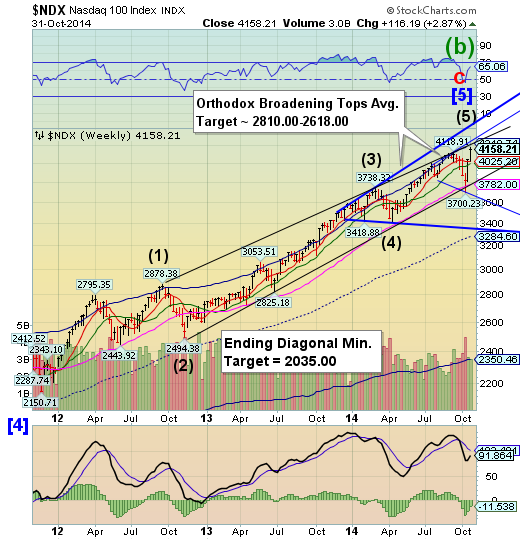
NDX rallied to the top of the Orthodox Broadening Top creating a new point 5 and expanding the formation.The Broadening Top formations in the indexes are larger than their predecessors and contemplate much larger swings than the prior formations.We are now at “point 5,” thanks to the Bank of Japan. The excitement isn’t over yet.
High Yield meets its Ending Diagonal trendline.
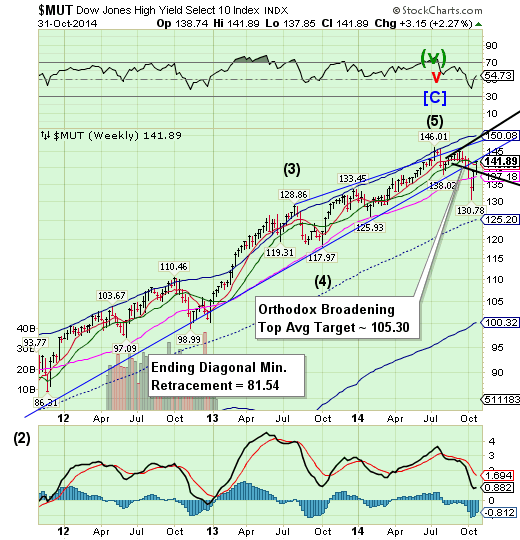
The Dow Jones High Yield Select 10 rallied back to the lower trendline of its Ending Diagonal formation.Traders often refer to this as the “kiss of death,” since a reversal from an Ending Diagonal usually means a complete retracement of that Diagonal.Now is time topay attention to the Orthodox Broadening Top formationas well.
(Reuters) Investors betting that oil prices will recover are starting to support the battered prices of high-yieldbonds from exploration and production (E&P) energy companies.
But market strategists warn they could face steep losses ahead if the price of oil remains under pressure - particularly if they are not more selective about which credits to buy.West Texas Intermediate, a benchmark for crude pricing, has fallen more than US$20 a barrel since June, from over US$105 at the time to US$82.65 this week.
That tumble has hit bonds in the E&P sector, which have taken a beating in the secondary market.
The euro is making new 2-year lows.
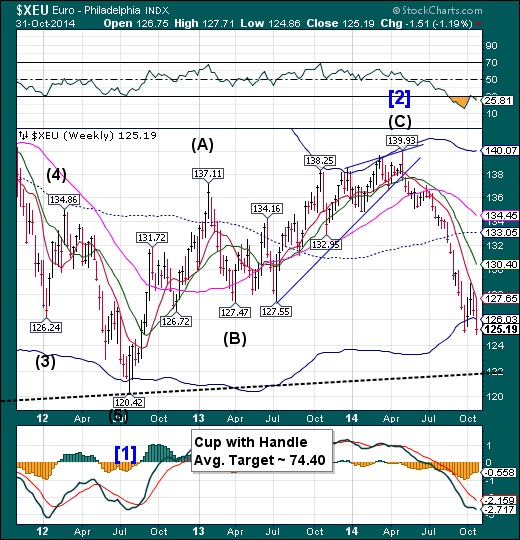
The Euro is making fresh 2-year lows as it broke down through Cycle Bottom support at 126.03.The next challenge may be the Lip of a Cup with Handle formation at 122.00.The next Cycle low appears to be expected in the first week of November, but it won’t be the final low of the decline.
(Reuters) - Inflation in the 18 countries sharing the euro edged up slightly in October, reinforcing the view that the European Central Bank will hold fire on any additional policy action at its meeting next week.
A first estimate on Friday from the European Union's statistics office showed consumer prices in the euro zone rose by 0.4 percent in October, in line with market expectations. A day earlier, German data showed inflation in Europe's largesteconomy slowing in October to 0.7 percent, its lowest reading since May.
Euro Stoxx extends “point 7.”
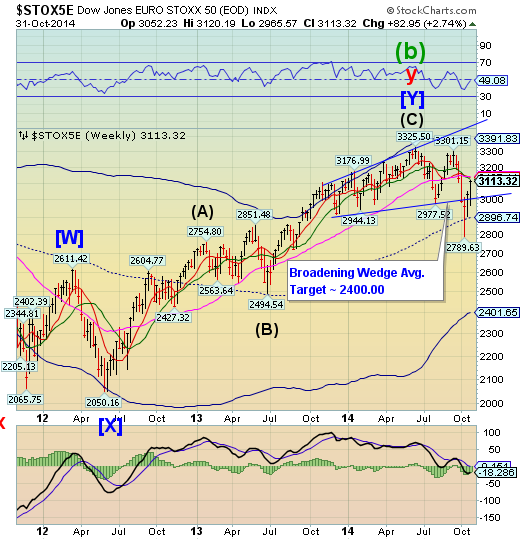
The DJ Euro Stoxx 50 Index extended “point 7” of its Broadening Wedge formation. Generally the throw-back inside the Broadening formations don’t exceed 50% of the prior decline. We can thank the Bank of Japan for providing the additional liquidity to make this happen. Thus far, EuroStoxx have not been able to overcome the cluster of resistance that lies overhead. This weekend may provide Stoxx a Cycle Pivot that may send it lower in the following weeks
(Bloomberg) European stocks rose to a four-week high amid optimism the Bank of Japan’s stimulus will fill some of the gap left by the end of Federal Reserve bond buying.
The Europe STOXX 600 Index gained 1.8 percent to 336.8 at the close of trading, boosting its weekly advance to 2.9 percent, the most this year. Barclays (LONDON:BARC) and BNP Paribas (PARIS:BNPP) led lenders higher, as all 19 industry groups on the gauge climbed.
The equity benchmark dropped 1.8 percent in October, the most since June 2013, amid concern the European Central Bank’s asset purchases won’t be enough to revive the region’s economy. With the Federal Reserve ending purchases this month, investors are turning to Europe and Japan for sustained support.
The Yen throws under its Bullish Wedge.
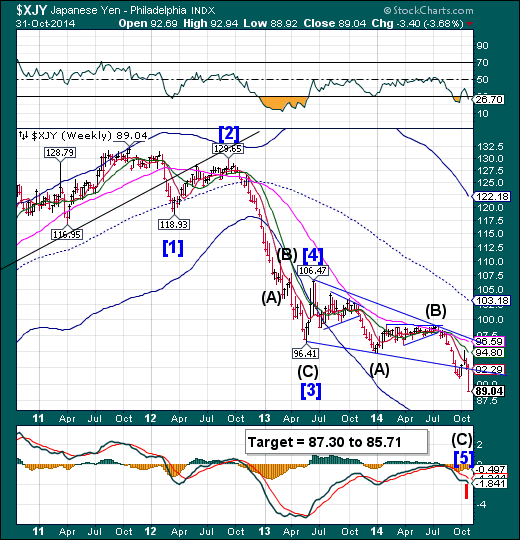
The Yen has continued its decline beneath its Falling Wedge formation. The bullish reversal must wait until a lower target has been reached. This appears to be an attempted re-ignition of the Yen carry trade to boost the equities markets.The Yen may hit its intended downside target by the end of next week.
(ZeroHedge) Due to the depreciation of the JPY, leading to soaring raw material costs (crushing SME profitability), TSR reports that Japanese bankruptcies year-to-date in 2014 are up a stunning 140%having unerringly surged since Abenomics was unleashed. Despite constant reassurance and propaganda from various political leaders each and every night that Japan is on the right track... it simply is not and if there is a better indicator of the death spiral Abe has unleashed than surging bankruptcies, we are unaware of one.
The Nikkei makes its final high.
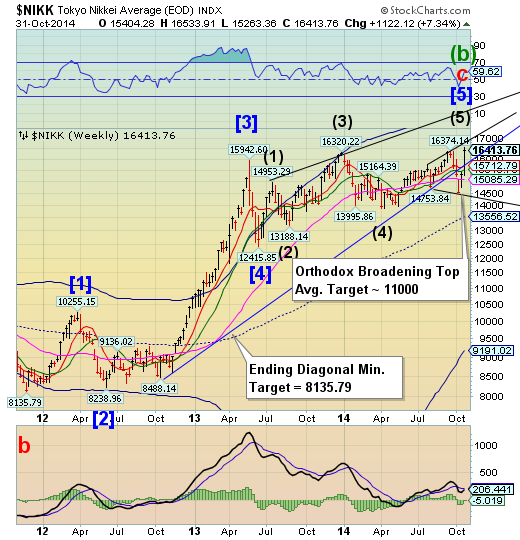
The Nikkei soared on the back of the devalued Yen to point 5 of its Orthodox Broadening Top formation.This is considered the peak of the formation and a decline to mid-cycle support at 13556.52 may be the next move. The Broadening formations represent a market that is out of control and has a highly emotional public participation. Of course, the bank of Japan is doing more than just cheerleading.
(ZeroHedge) Two days ago, when QE ended and knowing that the market is vastly overestimating the likelihood of a full-blown ECB public debt QE, we tweeted the following:
“It's all up to the BOJ now”
Little did we know how right we would be just 48 hours later.
Because as previously reported, the reason why this morning futures are about to surpass record highs is because while the rest of the world was sleeping, the BOJ stunned those few who were looking at Bloomberg screens with a decision to boost QE,announcing it would monetize JPY80 trillion in JGBs, up from the JPY60-70 trillion currently and expand the universe of eligible for monetization securities. A decision which will forever be known in FX folklore as the great Halloween Yen massacre.
U.S. Dollar breaks out ot new highs.
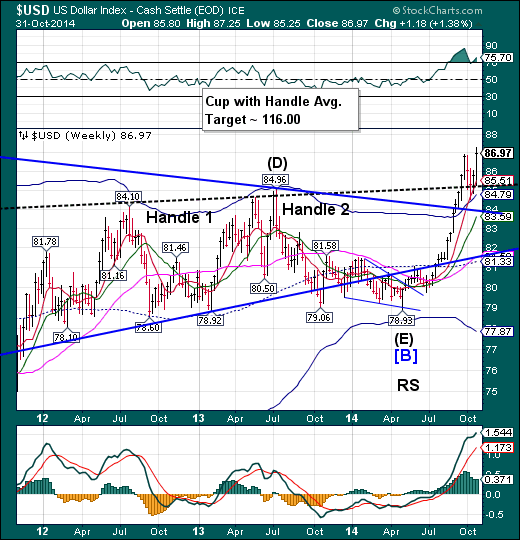
The US Dollar continued its rally this week with a new breakout high.Thedollar rally has made all of its near-term targets. It may rise another point or so, but the Cycles Model calls for a near-term high early next week. If so, we may see the Dollar weaken until mid-December.
(ThisIsMoney) The US dollar has hit a four-year high against other top world currencies after the Bank of Japan shocked markets by pumping extra emergency cash into its economy.
The surprise overnight decision sent global stock markets soaring, with the Dow Jones up 2.3 per cent on Wall St and the Footsie 1.2 per cent higher - but the yen plunged sharply on the news that Japan's central bank was stepping up stimulus efforts.
The Bank of Japan's move to crank up money printing to Y80trillion (£450billion) a year from Y60-70trillion cheered markets after the Federal Reserve this week made the contrasting decision to wind down its stimulus amid a US economic recovery.
USB reverses from its top.
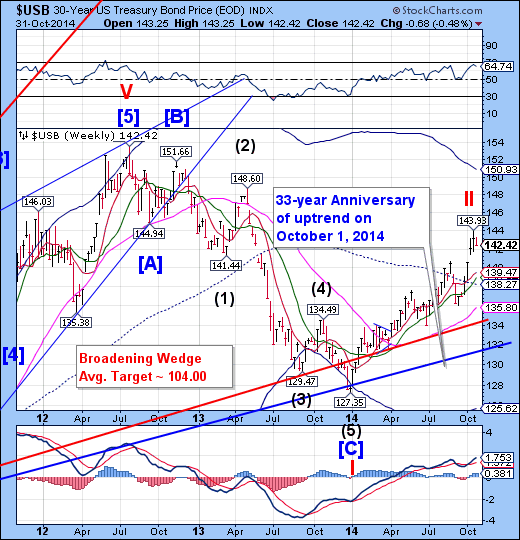
The Long Bond appears to have begun its reversal from the high.Should the decline continue, the odds arebetter-than even of an abrupt decline that may last into mid-November, where USB may break its 33-year old trendline.The potential target may be weekly Cycle Bottom support at 125.55. The final Master Cycle low appears to be due in mid-December.
(ZeroHedge) Earlier today, former CLSA strategist Russell Napier mused about the centrally-planned capital markets, pointing out the historicmove in bonds in the morning of October 15 about which he said:
On the 15th of October 2014, as this analyst celebrated his 50th birthday, volume in the US Treasury market surged, suddenly and without warning, to a record high. Old timers smiled knowingly, as Magwitch did from behind the headstones, and younger members put aside their Angry Birds and wondered what was wrong.
There it was --- a real market come and gone in half an hour, like a pregnant panda at Edinburgh zoo. What did it mean and what should you do? You should pay attention to what happens to the direction of prices when volumes surge and markets work. When the veil is lifted, pay attention to what you see beneath. Last Wednesday, in the space of half an hour of active trading, the Treasury market had one of its most rapid rises ever recorded and equities fell sharply.
Gold breaks a 16-month old support.
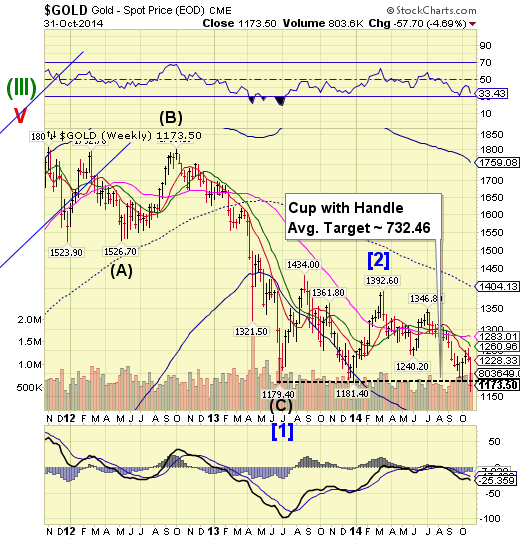
Gold broke through a 16-month old support at 1183.00 this week. The sell-off heralds in the next phase of the decline that may go as far as its Cup with Handle formation target listed on the chart. The Cycles Model suggests a probable 5-6 week decline into early December.
(Reuters) Gold and silver sank to their lowest since 2010 on Friday as the dollar surged against the yen and other major currencies after the Bank of Japan shocked global financial markets by expanding its massive stimulus spending.
Spot gold broke below $1,180 an ounce, a level bullion had held twice during its last two major sell-offs in June and December last year. It also briefly held the mark earlier this month until Friday's drop.
The decline in Crude Oil still not be over yet!
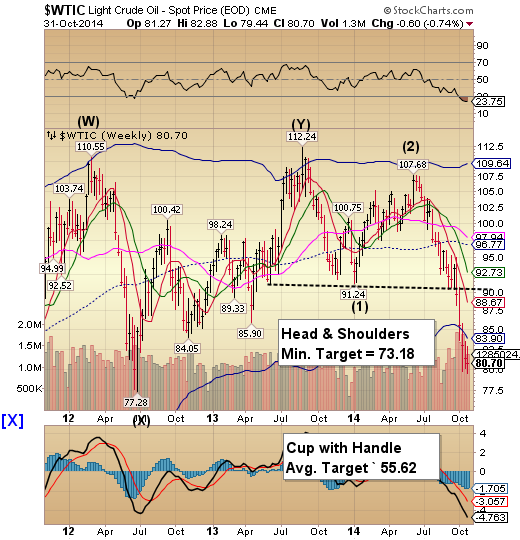
Crude broke its prior low, signaling the resumption toward its Head & Shoulders target.This is likely to occur during the second week of November. Once accomplished, there may be a few weeks of consolidation before it resumes a further decline.
(ZeroHedge) While large shifts in positioning precipitated a sell-off in oil prices that far exceeded the actual weakening in fundamentals, Goldman Sachs' confidence in a 2015 oversupplied global oil market has increased. As a result, they have brought forward their medium-term bearish oil outlook (WTI crude oil forecast is$75/bbl for 1Q15 and 2H15 (from $90/bbl previously)). WTI just broke below $80 back to June 2012 levels once again as Goldman also downgraded the entire oil service space (happily buying up muppets' positions as they sell).
China Shanghai Composite get a boost from BoJ.
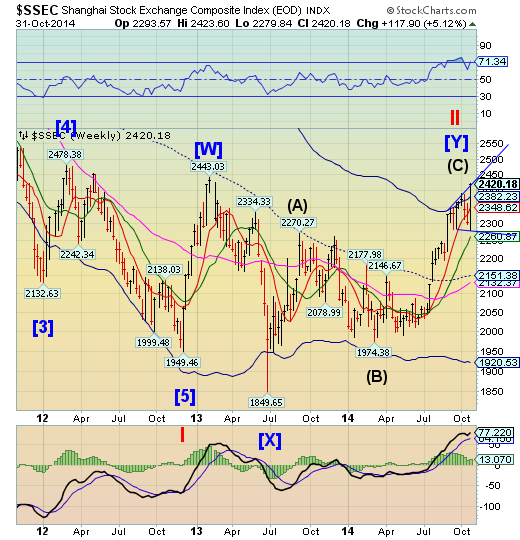
The Shanghai Index alsogot a boost from the Bank of Japan, sending it to new highs and a point 5 of an Orthodox Broadening Top.Theprojected decline did not go as far as Intermediate-term at 2260.87, the next support level. The rally may be due for a full retracement to the Cycle Bottom at 1920.53. China stocks have nearly a month of decline ahead before reaching a significant bottom.
(ZeroHedge) When Chinese property developer Agile Property Holdings Ltd. said this month that its chairman was taken into custody by authorities, the disclosure was a shock to Western banks that lent the company money, according to China Spectator as the fog of ever-rising asset values suddenly evaporates into the reality of an opaque real estate credit market slap them in the face. The simple fact is "it is very difficult to get a handle on the financials of a Chinese company," as a local investigative consulting firm warns "in China, nothing is what it appears to be."
The Banking Index “throws back” inside its Broadening Wedge.
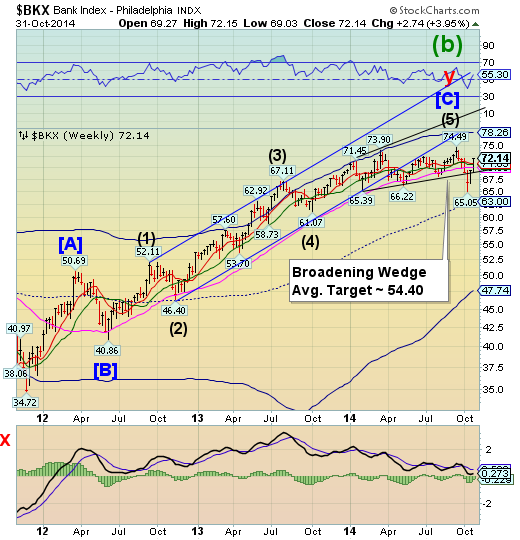
-- BKX threw back inside its Broadening Wedge, rallying above all Model support/resistance.This may still be considered point 7 ofthe Broadening Wedge formation. The next target (point 8) may be 20% lower.
(ZeroHedge) Call it Monitoring Universe of Non-Bank Financial Intermediation (MUNFI), Other Financial Intermediaries (OFI), non-bank financial intermediation or, easiest of all, by its widely accepted name,Shadow banking. Whatever you want to call it, the latest just released estimate by the Financial Stability Board of how many assets current exist outside of the regular banking system (and are thus in the shadows) around the globe should explain why these day the one thing central bankers are most worried about is the uncontrolled proliferation of shadow assets (technically it is liabilities, but that is a different discussion). The reason: according to the broadest measure of shadow banking, it grew by $5 trillion in 2013 to reach $75 trillion. This represents some 25% of total financial assets and when expressed in terms of global GDP, it amounts some 120% of global GDP.
(ZeroHedge) A week ago, when showing the following chart of Chinese housing trends...
... we reported that the "burst Chinese housing bubble leads to first annual price decline since 2012", and warned that it is only a matter of time before both China's GDP, extensively reliant on housing construction, as well as Chinese bank assets, primarily consisting of housing-related loans and other fixed income exposure, take a major hit
This happened yesterday, when in an exchange filing China's Industrial & Commercial Bank of China, the biggest bank in both China and the entire world, reported its biggest jump in bad loans since at least 2006.
(ZeroHedge) Despite the ban on short-sales - which has never worked in the past to do anything but instil fear in traders' holding long positions - Italian banks are in free-fall following the utter failure of Draghi's stress tests to encourage confidence in the European banking system.
