Just when it looks like Shorts have a handle on this market bulls go and Make America Great Again. Market rallies undo much of the weakness over the last three days and give bulls something to play with. Although bulls are not yet out of the woods.
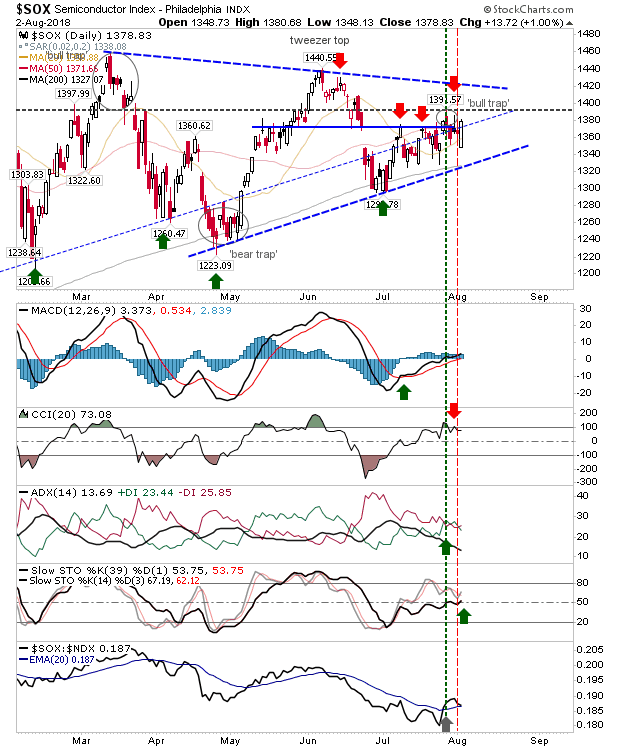
The Semiconductor Index was my bearish choice for Thursday and the index logged a 1% gain. While it didn't reverse all of its 'bull trap' it did push markets away from its 200-day MA; action since last June has been scrappy but it has managed to edge a little higher each day. I would still edge in favor of shorts but another day like today would end this and set up a challenge of triangle resistance.
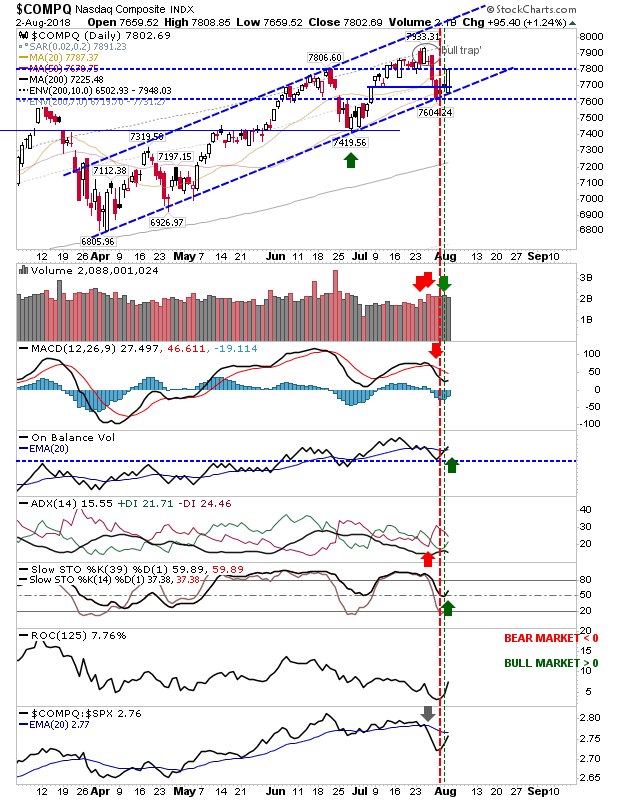
Today's gans were a boon for the NASDAQ Composite and NASDAQ 100. The former index rallied off channel support as it generated new 'buy' signals for On-Balance-Volume and Stochastics. Next up is a challenge of the 'bull trap'.
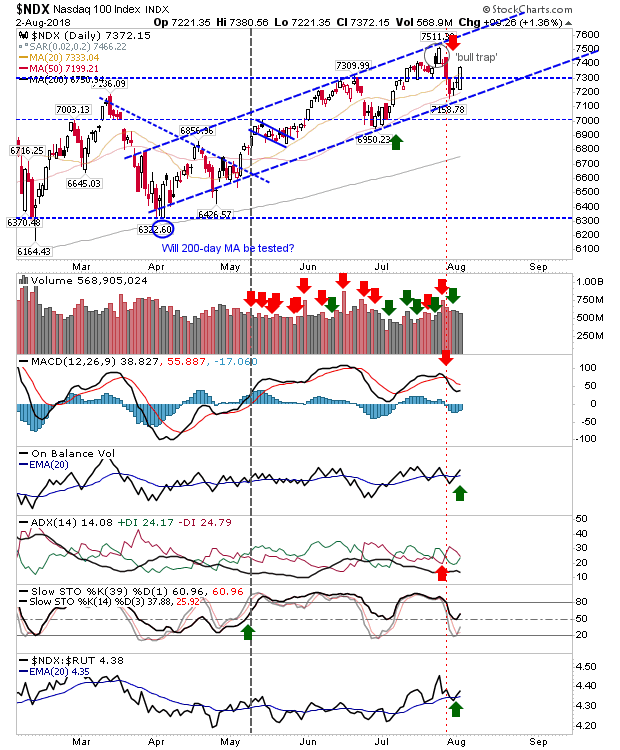
The NASDAQ 100 is positioned more central in its channel. It saw an uptick in relative performance and a 'buy' trigger in On-Balance-Volume. The launch point for the rally was the 50-day MA but it didn't tag channel support. Like the other, it's challenging its 'bull trap'.
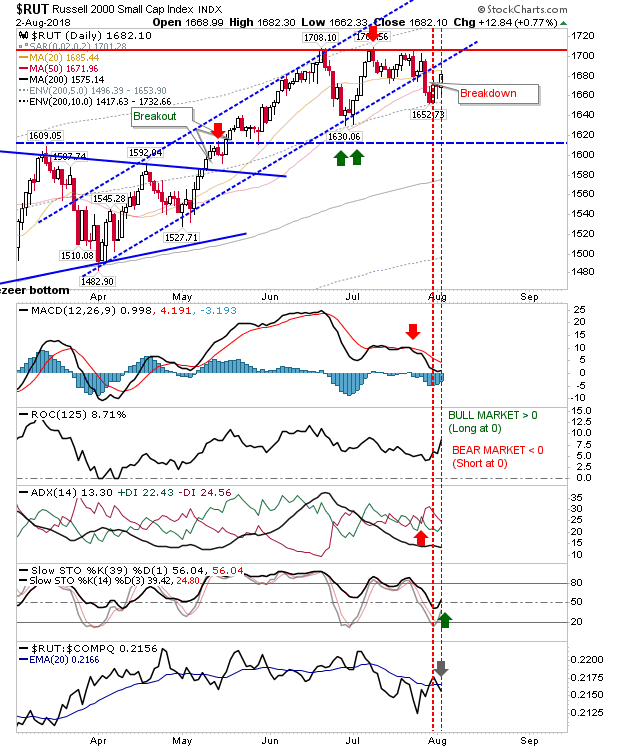
The Russell 2000 posted a gain of just under 1% but it has yet to reverse the channel breakdown. Like the NASDAQ 100 it's lingering near its 50-day MA. Bulls need a confident break of 1,710 but support at 1,650 should be significant; a 3:1 risk reward would need a move to 1,770 which doesn't look unreasonable.
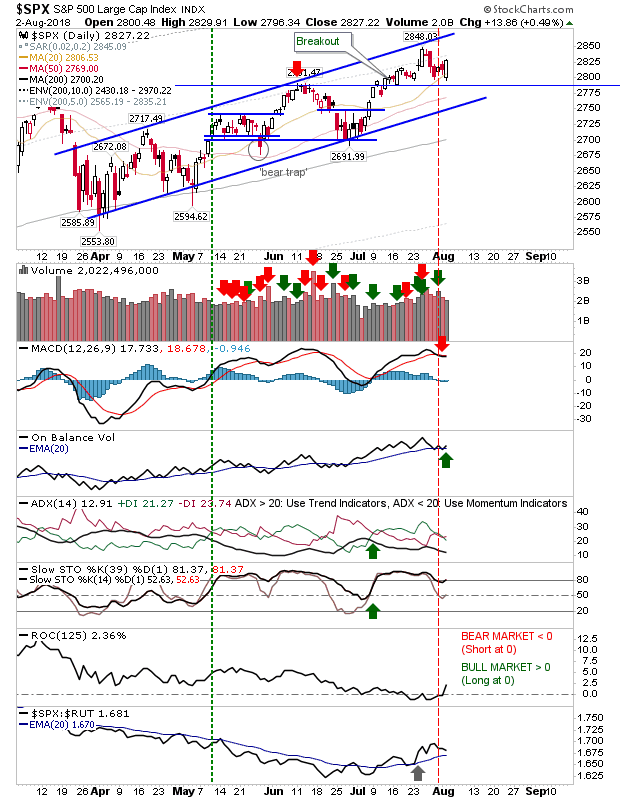
Large Caps are more neutral. The S&P 500 trades above 2,780 support and today's bullish engulfing pattern leaves it well placed to negate the 'sell' trigger in the MACD. Relative performance has moved markedly in favor of the index.
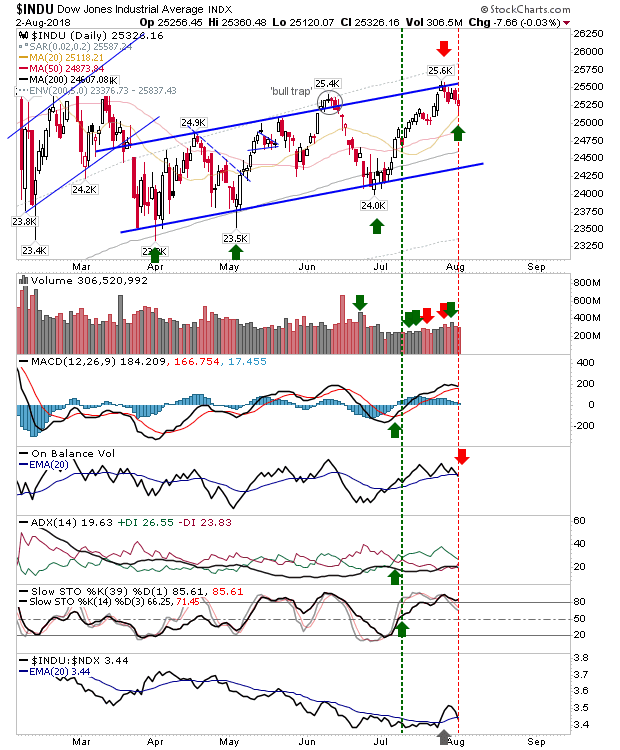
While the Dow is not as well positioned at the S&P 500, today' bullish hammer off it 20-day MA sets the index up nicely to challenge and break the gently rising channel. The only negative was a 'sell' trigger in On-Balance-Volume but this metric has traded flat for the last 6 months. Stops on a loss of 25,120.
For Friday, bulls have the Dow Jones and maybe the SPX. Shorts have the Russell 2000 to work although the Semiconductor Index looks like it's waiting for a break of the consolidation triangle before a new trend can be determined.
