Tuesday August 9: Five things the markets are talking about
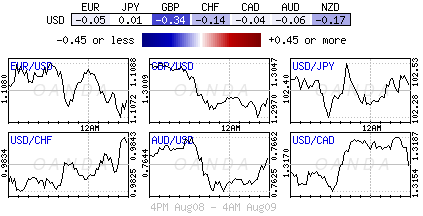
Investors are revising their latest outlook about the direction of the ‘mighty’ dollar – mainly on account of last week’s stellar nonfarm payroll (NFP) report and the Bank of England’s (BoE) latest rate decision – and the changing odds for a Fed rate hike in H2.
This mood of optimism has seen a tentative recovery in risk appetite, which has managed to pull global equities and commodities such as oil higher, but can these moves continue with a stronger dollar?
Currently, with the lack of Tier I economic data, there is little to derail this near term optimism, even in spite of last weekends disappointing China trade data.
In overnight trading, the world’s second largest economy released its inflation data, much of which has been taken as encouraging, supporting Asian equities.
Despite China CPI remaining sluggish at +1.8% (expected), its the PPI (producer prices index) coming in ahead of expectations at -1.7% (-2.0%e) that is giving rise to market optimism that there are signs of an improvement in China’s slowdown.
Stateside, investors’ attention will now turn to Friday’s U.S retail sales number. If the headline print happens to fall short of expectations, expect the market to quickly recalibrate all of this week’s “risk-on” pricing.
1. Global bourses remain in the “black”
Same theme, but a new trading day – Asian stocks were broadly higher in overnight trading, supported mostly by rising crude oil prices and upbeat data from China.
The Nikkei Stock Average added +0.7%, while Australia’s S&P/ASX 200 rose +0.3% and South Korea’s KOSPI gained +0.6%. The Shanghai Composite Index climbed +0.7%, though Hong Kong’s Hang Seng Index retreated -0.1%.
China’s PPI date beating expectations (-1.7% vs. -2%) suggests that the declines in producer prices may be bottoming out, after lingering in deflationary territory for the last couple of years. Persistent rumours that OPEC may be planning to hold “informal” talks next month, possibly leading to production cuts, has managed to drag oil prices up to current levels (+2.9% yesterday). This move has oil and natural gas producers benefiting from this lift.
Ahead of the U.S open, Euro equities are continuing Asia’s positive work. Banking sector is generally leading the gains in both the Euro Stoxx 50 and the FTSE 100, while profit taking is seen in commodity and mining stocks.
Indices: Stoxx50 +0.4% at 2,997, FTSE +0.3% at 6,828, DAX +0.4% at 10,478, CAC 40 +0.5% at 4,436, IBEX 35 +0.3% at 8,950, FTSE MIB +0.6% at 16,836, SMI +0.1% at 8,178, S&P 500 Futures flat
2. Profit taking in oil, gold flounders
Prices can only go so high before some rational logic again takes hold. This is what is happening in the Euro session’s oil market.
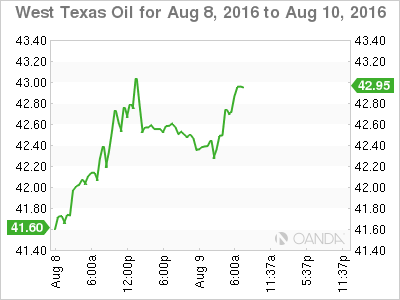
Crude prices are beginning to move to the back foot ahead of the North American session as continued worries over a global oil ‘glut’ and profit-taking on gains of nearly +3% this week trump the possibility of an OPEC meeting (scheduled) to discuss production cuts next month. With rising oil prices, why would countries like Russia ever entertain a production cut? Putin prefers to keep his distance from OPEC.
Brent crude for October is down -30c at +$45.09 a barrel, after settling up +$1.12, or +2.5%. After falling nearly -15% in July, Brent prices so far this month are up about +6%. West Texas Intermediary for September delivery is down -28c at +$42.74 a barrel, after closing up +$1.22, or +2.9%, on Monday. The U.S. benchmark lost about -14% last month and is up about +2.5% in August.
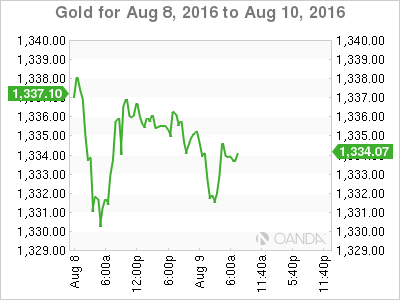
A strong dollar does not benefit bullion prices. Gold continues to hover near its one-week low print yesterday as the dollar tentatively firms amid increasing possibilities of a Fed rate hike this year.
Spot gold has eased -0.2% to +$1,331.97.
3. Treasury yields telling a different story
After plunging to record lows in the aftermath of the U.K.’s vote to leave the EU in late June, U.S Treasury yields have picked up in recent weeks. However, despite July’s stellar non-farm payroll (NFP) report, yields still have some room to rise before reaching their pre-Brexit levels, when the yield on the 10-Year note topped +1.7% (currently trading atop +1.574%).
U.S yields have the potential to push back a tad further this week for two reasons. First, U.S dealers will need to make room to take down a plethora of new bonds, starting with today’s +$24B sale of three-year notes, tomorrow’s 10-year note and Thursday’s long bond auction. Second, the lack of any new major new data this week should be difficult to contradict last week’s U.S upbeat employment message.
With Fed funds futures prices showing that dealers now see nearly a 50-50 chance that the Fed will raise rates by December has longer-dated maturities backing up to their highest level in more than two-weeks.
The negatives, higher yields are expected to attract strong demand from foreign investors who domestically are combatting ultralow or negative yields (ECB and BoJ). Under this scenario, rates should remain somewhat capped for the foreseeable future.
4. Pounds woes continue
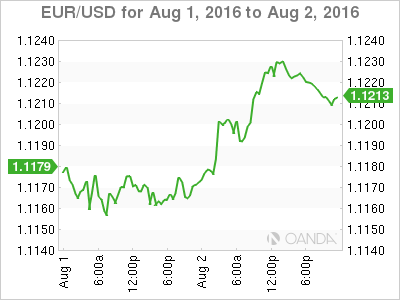
Sterling is trading firmly below the psychological £1.3000 level for the first time in nearly a month on comments from a BoE hawk McCafferty who acknowledged that further easing is likely to be necessary as it was difficult to forecast the headwinds from the Brexit vote on the economy.
Even today’s U.K data, despite its pre-Brexit significance, is not helping matters. June’s U.K. manufacturing production (-0.3%) and trade data (-£12.4B) both came in slightly worse than expected.
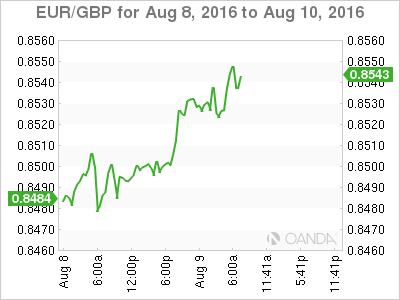
EUR/GBP has now risen to a new one-month high in European trading of €0.8546. Technical analysts believe closing above this level would provide momentum for the single currency to trade a lot higher, towards €0.92-0.94 level as the U.K will continue to have problems attracting inflows of funds to finance its current account deficit now that the BoE has shown its new aggressive monetary policy hand.
5. Carry trading supports Australasia pairs
The Kiwi and the Aussie dollar are the highest yielding currencies in the G10. Even the immediate threat of rate cuts by their respective central banks is finding it difficult to weigh down either currency. Why? This is due to the insatiable demand by investors to want hold yield that is currently supporting these currencies (NZ$0.7145, A$0.7660). If the respective governors want to weaken their currencies even more they need to be more aggressive in their rate cuts.
Ahead of this week’s Reserve Bank of New Zealand (RBNZ) decision Thursday, swaps markets have boosted expectations of a more aggressive -50bp cut to +15% from +10%. Already a -25bp cut is priced in, with another -25% by year-end.
No matter the outcome, with the public holiday in Japan this week, thin liquidity conditions will make Kiwi traders a tad more apprehensive.
