Monday May 15: Five things the markets are talking about
Global equities start the week better bid, shrugging off cyber attack threats, a missile test in North Korea, and weak U.S data.
Friday’s U.S. retail sales and inflation data may suggest that expectations for global growth have run too high.
Nevertheless, investor optimism over China’s international infrastructure plans (an alternative to TPP) is offsetting concerns over the strength of the global economy.
Oil and commodity currencies are surging on expectations for a supply cut.
In Germany, Chancellor Merkel party won an election in the country’s most populous state yesterday, solidify her lead ahead of Germany national election in September.
The Fed remains on track to hike rates next month with jobless claims at a 28-year low and the unemployment rate down to +4.4%, however, the odds have fallen to +70% from +83% on waning U.S inflation outlook.
On the data front this week, in Japan, GDP for Q1 will be the focus, with growth expected to have accelerated. In the U.K, inflation numbers are due tomorrow, followed by a labor market report Wednesday.
In the U.S, it’s a slow week, however, tomorrow’s industrial production print will provide useful insight into how the factory sector is performing.
1. Despite geopolitical risks, equities supported
Resilient Asian stocks continue to trade atop of their two-year high overnight, shaking off threats from a ransom ware attack and North Korea saber rattling.
In Japan, regional stocks were small pressured by a stronger yen (¥113.47). The Nikkei share average fell -0.1%, while the broader TOPIX fell -0.04%.
In Hong Kong, the Hang Seng China Enterprises Index rose +1.5%, climbing for a sixth consecutive session.
In China, the Shanghai Composite Index rose +0.2%, and the Hang Seng Index advanced +0.7%.
In Europe, it’s a quiet start to trading despite the event packed weekend. The STOXX 600 has added +0.2%, after touching the highest level in two years last week. The FTSE has got a boost from the uptick in commodities.
U.S stocks are set to open little changed.
Indices: Stoxx 50 -0.2% at 3631, FTSE +0.1% at 7444, DAX little changed at 12763, CAC 40 -0.1% at 5400, IBEX 35 +0.2% at 10920, FTSE MIB +0.3% at 21642, SMI -0.3% at 9100, S&P 500 Futures +0.1%
2. Oil jumps as Russia and the Saudi’s back longer supply cuts
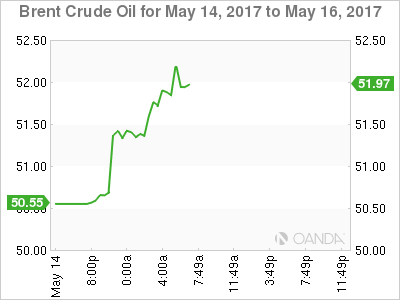
Oil prices have rallied more than +2% ahead of the U.S open, after Saudi Arabia and Russia said supply cuts need to last into next-year.
The market views this as a step towards keeping an OPEC-led deal to support prices in place longer than originally agreed.
Energy ministers from both countries said that supply cuts should be extended for nine months, until March 2018.
Note: That is longer than the optional six-month extension specified in the November 2017 deal.
Brent crude has rallied +$1.20 to +$52.04 a barrel, while U.S light crude (WTI) is up +$1.18 at +$49.02 a barrel.
Note: Global inventories remain high, and the output from other producers, especially the U.S is rising, which is keeping prices below the psychological +$60 some OPEC members would like to see.
OPEC and non-OPEC countries meet to decide policy on May 25 in Vienna
Data on Friday showed that U.S. energy firms added oil rig’s for a 17th consecutive week, extending a 12-month drilling recovery.
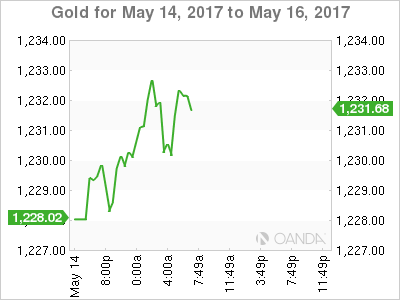
Gold prices have edged higher on weaker-than-expected U.S data and a missile test by North Korea over the weekend pressured the dollar. Spot gold is up + 0.3% at +$1,232.45 per ounce. The yellow metal rose +0.3% on Friday.
3. Global yields on the move
Friday’s disappointing U.S. data (Retail Sales and CPI) has fixed income dealers trimming the odds for a Fed hike next month. Fed fund futures currently see a +70% chance of a hike, down from +83% Friday morning.
The yield on 10-year Treasury notes has backed +1 bps to +2.34%, after dropping -6 bps Friday when the weaker-than-expected CPI report buoyed bond prices.
Elsewhere, yields on Aussie 10’s lost -5 bps to +2.59%. Benchmark yields in France and Germany rose +1 bps.
A rise in German yields above the psychological +0.5% mark is expected to meet with strong resistance, however, the strengthening economic development in the eurozone and the robust outlook may make ECB monetary policy normalization conceivable and even sooner than later.
4. “Big” dollar losing some love
Last weekend’s G7 Finance Ministers and central bank meeting did not provide any surprises.
G7 reiterated its pledge on FX – “that excess volatility was bad for growth” and declared their commitment against “competitive devaluation.”
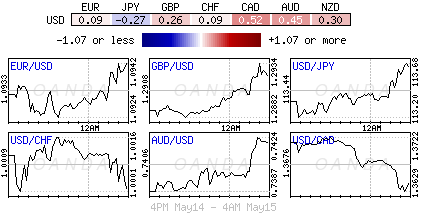
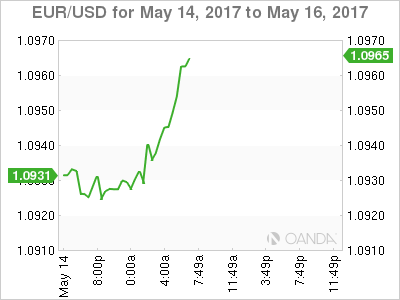
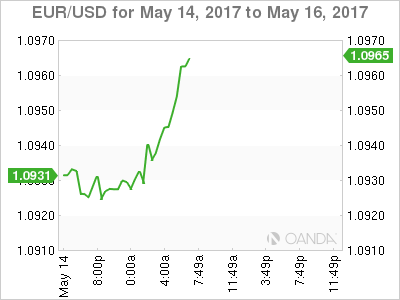
Ahead of the U.S open, the FX markets are somewhat subdued with the USD facing resistance from further underwhelming data. The EUR remains steady trading atop of €1.0940, while USD/CHF has dipped below parity to $0.9989. The pound continues to flounder below £1.2950, while USD/JPY is little changed at €113.42.
Petro-currencies (NOK, CAD, MXN) have all got a boost from higher crude oil prices overnight.
Note: Turkish markets will watch President Erodgan’s meeting with U.S President Trump tomorrow. It’s considered crucial for geopolitical developments in the region- USD/TRY is last down -0.3% at $3.5618.
5. China’s Xi and data
China President Xi said on Sunday that China would “strike a balance between financial stability, gradual deleveraging, and steady economic growth, noting that China was capable of maintaining stability in its financial markets.”
Such market-friendly language helped offset economic concerns triggered by news that China’s factory output and fixed asset investment growth cooled more than expected last month.
China April Industrial Production: y/y – +6.5% vs. +7.0%e, while Retail Sales: y/y – +10.7% vs. +10.8%e.
China National Bureau of Statistics (NBS) said that economic growth was still within a “reasonable range,” yet; overcapacity remained a serious problem in some sectors.
