Monday April 2: Five things the markets are talking about
Trading remains light, with major currencies little changed, amid the last day of the Easter holidays.
Note: There is a bank holiday in most of Europe today (Sw., Ger., Fr., It. and the U.K).
This shortened trading week features inflation and unemployment figures in Europe, the March U.S. and Canadian jobs report, and an interest-rate decision down-under.
On Tuesday (Apr. 3), the Reserve Bank of Australia (RBA) will release its policy statement. The inflation outlook, weak wage growth and consumer-spending risks give the RBA reason enough to stand pat.
Data last week showed that the eurozone’s annual rate of inflation fell for a third consecutive month in February, reinforcing the ECB’s sense of caution as it considers further steps to wind down its QE programs.
Nonetheless, this Wednesday (Apr. 4), relief may be at hand, with ‘flash’ CPI forecasting from Eurostat are expected to record a pickup to +1.4% in March, from +1.1%. Other separate data is expected to show a further decline in E.U unemployment for February – this may strengthen the ECB’s conviction that inflation will reach its target of just below +2% next year.
On Friday (Apr. 6), both the U.S. and Canada will release jobs data for March. Both economies recorded robust growth in February, and given the recently low number of layoffs stateside, analysts are expecting the unemployment rate to drop to a near two-decade low of +4%.
1. Stocks in choppy waters
In Japan overnight, equities edged lower in choppy trading, with volume falling to the lowest in more than three-months, with real estate and banks again underperforming. The Nikkei ended -0.3% lower, while the broader Topix dropped -0.4%.
Down-under, the ASX 200 was closed for the holidays, while S. Korea’s KOSPI gained +0.8%.
Note: The Reserve Bank of Australia (RBA) meets tomorrow to decide on cash target rate – market expectations are for unchanged.
In Hong Kong, the Hang Seng was closed for the holidays.
In China, stocks kicked off Q2 with mild losses overnight, amid lingering worries of a full-blown trade war between the U.S and China. At the close, the Shanghai Composite index was down -0.2%, while the blue-chip CSI 300 index was down -0.3%.
In Europe, most of the major bourses are closed for Easter Monday.
2. Oil is higher on lower U.S. drilling, Iran sanctions concern
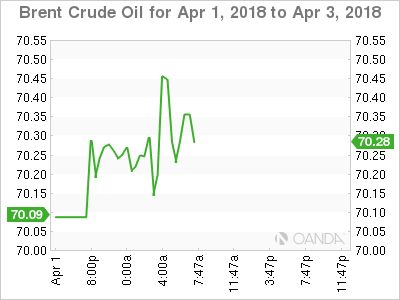
Oil rose towards +$70 a barrel, lifted by a drop in drilling activity in the U.S. and concerns that Washington could reintroduce sanctions against Iran.
Brent crude futures have rallied +58c to +$69.92 a barrel. It still below this year’s high of +$71.28 reached on Jan. 25, while U.S. crude (WTI) added +38c to +$65.32.
Note: Trading volumes are lower than normal as many countries are still on Easter holiday.
Baker Hughes data last week showed that U.S drillers cut -7 oilrigs in the week to March 29, bringing the total down to +797, the first decline in three-weeks
However, the Iranian factor could have a significant impact on the market for the next month. President Trump has threatened to pull out of a 2015 international nuclear deal with Tehran under which Iranian oil exports have risen. He has given the European signatories a May 12 deadline to “fix the terrible flaws” of the deal.
Possibly capping prices could be the U.S./China trade war getting out of hand. Any increase in trade friction is likely to rock global markets and tarnish any bullish sentiment in crude prices.
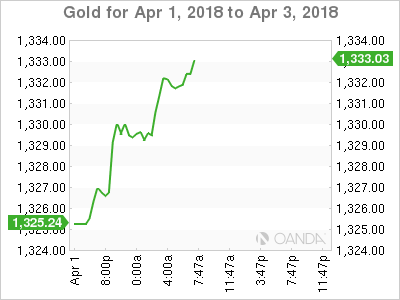
Ahead of the U.S. open, gold prices have rallied as the ‘big’ dollar eased a tad amid renewed concerns over a trade war after China imposed additional tariffs on U.S products (see below) in response to the U.S. duties on imports of aluminum and steel. After falling in the past three-trading sessions, spot gold edged up +0.5% to +$1,331.19 per ounce.
3. Sovereign yields little changed
Narrow ranges across Bunds and most Euro and U.S. spreads amid lower volumes, despite the U.S. ‘s record supply last week, would suggest that the fixed income market remains in holiday mode.
Note: In total and by week’s end, the U.S. Treasury auctioned +$294B of bills and notes, its largest slate of supply ever.
From Thursday’s close, the yield on 10-year U.S Treasuries have dipped -1 bps to +2.78%, the lowest in more than seven-weeks. While in the U.K, the 10-year Gilt yield has advanced +1 bps to +1.366%, the biggest gain in more than a week, while in Germany, the 10-year Bund yield increased + 1bps to +0.51%, the first advance in more than a week.
In Japan overnight, the key 10-year JGB futures contract touched a two-week low, weighed down by fixed income dealers selling ahead of a 10-year JGB auction on Tuesday.
4. Trade war looms for the dollar
FX markets are quiet as Europe continued with its extended Easter holiday, but investors and traders remain wary over global trade tensions.
On Sunday, China announced that it had increased tariffs by up to +25% on 128 U.S. products including frozen pork, wine and certain fruits and nuts in response to U.S. duties on imports of aluminum and steel last week. The tariffs are to take effect today.
On the other side, the Trump administration is expected this week to unveil the list of Chinese imports targeted for U.S tariffs to punish Beijing over technology transfer policies. The list of +$50B+ worth of annual imports is expected to target largely high technology. However, unlike China, the tariffs could take more than two-months before going into effect.
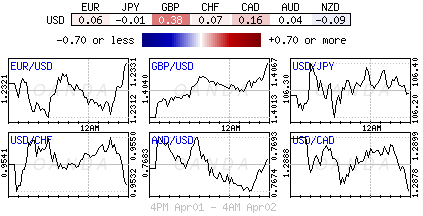
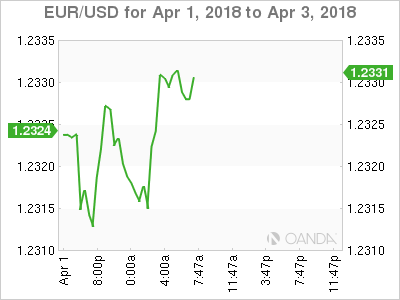
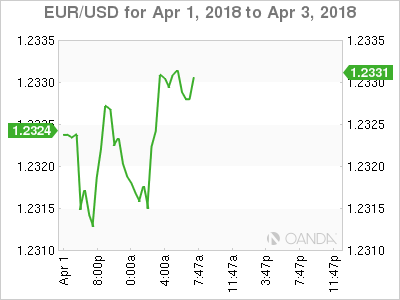
The EUR remains in the middle of this years trading range, trading atop of the psychological €1.23 handle at €1.2329. USD/JPY is little changed at ¥106.30, while the pound (£1.4069) came under pressure from quarter-end selling, and remains somewhat unmoved by last Thursday’s UK GDP data (unchanged at +0.4% q/q).
5. BoJ Tankan survey shows softer sentiment
A BoJ’s survey showed that confidence among Japan’s large manufacturers weakened for the first time in two-years in Q1 as they grew cautious about their business outlook amid the yen’s appreciation, stock falls and the latest U.S trade measures.
The main index measuring large manufacturers’ sentiment was at +24 in the three-month period, compared with plus +25 in Q4/2017.
Digging deeper, the BoJ’s Tankan corporate survey shows price pressures are also rising. It suggests that consumer price inflation will rise to around +1.5% over the coming months.
Note: In February, core-inflation rose +1% for the first time in three and a half years.
The result comes at the end of a quarter in which the yen gained +6% outright, Japanese stocks fell -5.8% and the U.S. slapped tariffs on steel and aluminum without giving Tokyo an exemption offered to other close allies. The survey also showed that big manufacturers see profits falling -3.2% in the year ending March 2019.
