Options expiration played into Friday's volume, but it was a decent push by bulls for a rally which is in the latter stages of its run (at least on an intermediate time frame).
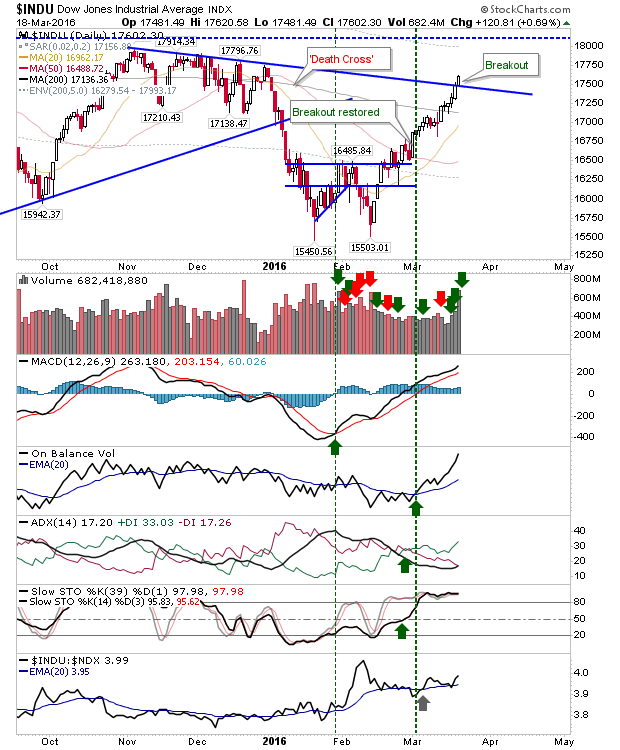
The Dow had the best of the action as it cleared declining resistance defined by Winter 2015 highs. The next challenge for this index will be the all-time high. The index is also looking to build on the strong relative performance it's enjoying against Tech indices. Other technicals are all in the green.
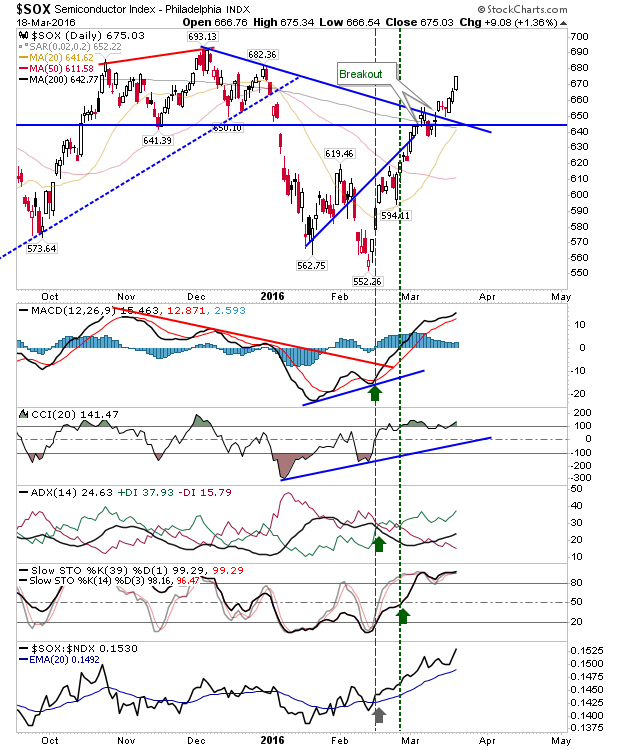
Aiding the Nasdaq and Nasdaq 100 is the powerful rally in the Semiconductor Index. Its next target to break is 693, the 52-week high. Semiconductors have had the best of the action since February, significantly out-performing other indices. Not even Small Caps can lay a claim over this index.
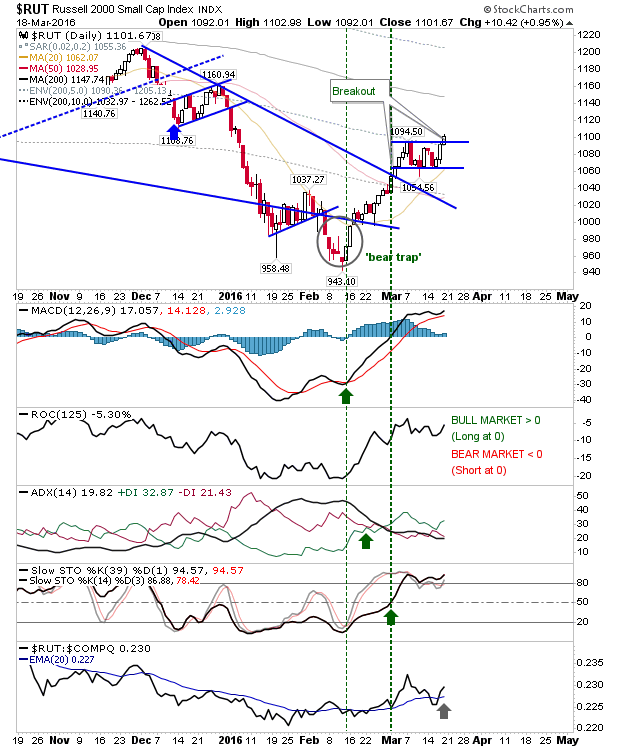
The Russell 2000 has resumed its upward advance as it clears the narrow consolidation. The ROC still hasn't made it back to the mid-level zero line, so this is still a bear market rally. Small Caps have also seen a return in the up tick in relative performance begun in early March. As Large Caps have already broken beyond their 200-day MAs one would expect Small Caps to (eventually) do likewise. Bulls might like the look of this next week.
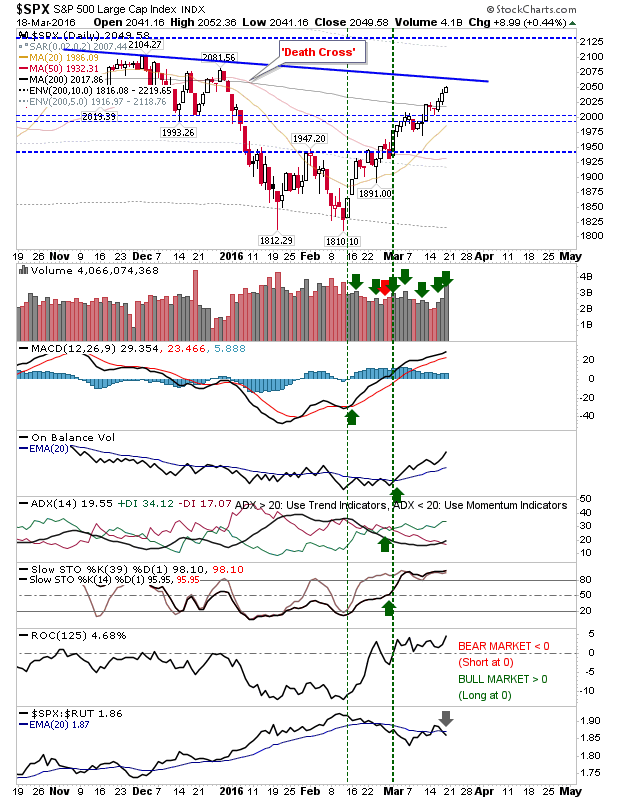
The S&P hasn't yet matched the Dow in breaking declining highs, but it only briefly paused at the 200-day MA before it pushed on. However, while the Dow didn't struggle at this point there is still a chance comparable resistance will play a role in the S&P.
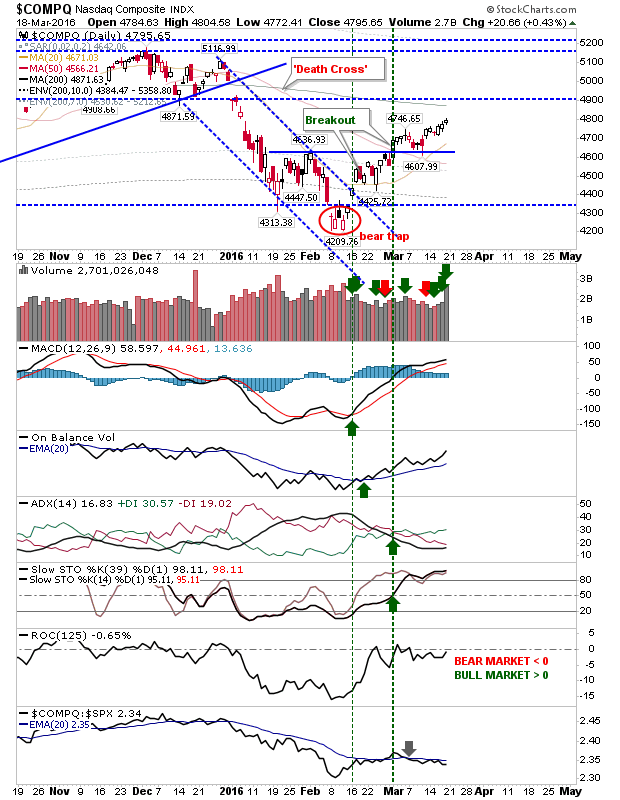
The Nasdaq is bobbling around the zero level of ROC typical of differentiating between bull and bear markets. Other technicals remain net green, although relative performance is drifting. Shorts looking for opportunities might be skulking around this index and its component stocks. The question will be how much the Semiconductor Index can contribute to bullish strength in this index.
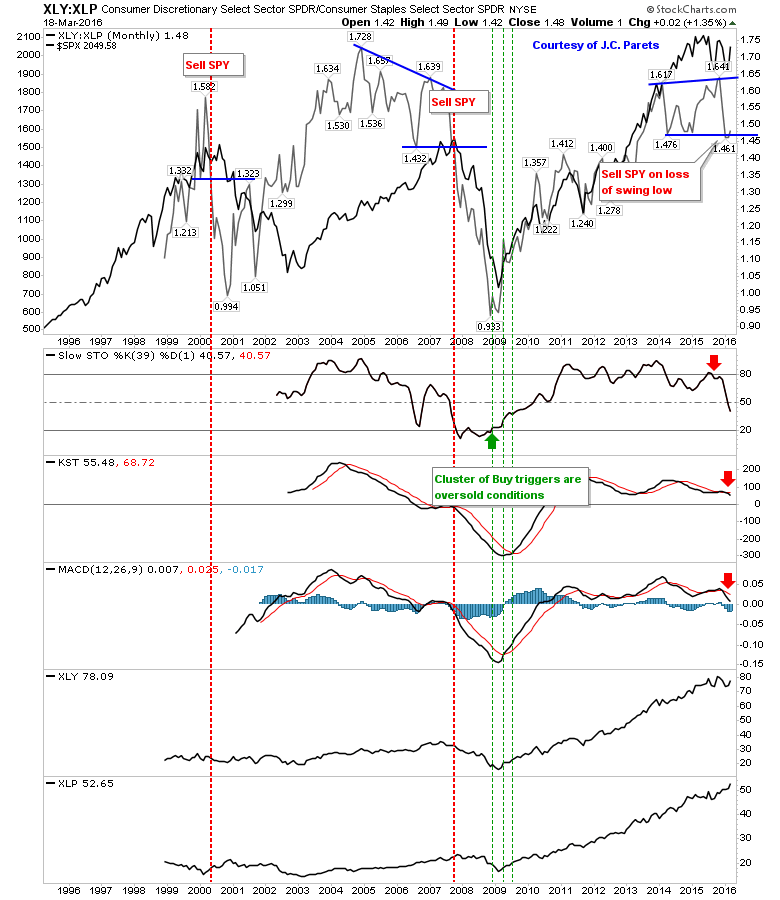
Shorts will be wanting to keep an eye on the Discretionary:Staples ratio. This chart was run by J.C. Parets, and it's suggesting bulls might not have it all their own way. The relationship between the two sector SPDRS and technicals point to weakness, which is contrary to the price action seen in the S&P.
For next week, watch how markets react to Semiconductor strength, yet Nasdaq under performance. Despite S&P strength, technicals suggest bears might be gaining the upper hand. Short term traders who managed to grab the February lows should probably be looking at taking some of their profits.

