Trend Model signal summary
Trend Model signal: Neutral (upgrade)
Trading model: Bullish
The Trend Model is an asset allocation model which applies trend following principles based on the inputs of global stock and commodity price. In essence, it seeks to answer the question, "Is the trend in the global economy expansion (bullish) or contraction (bearish)?"
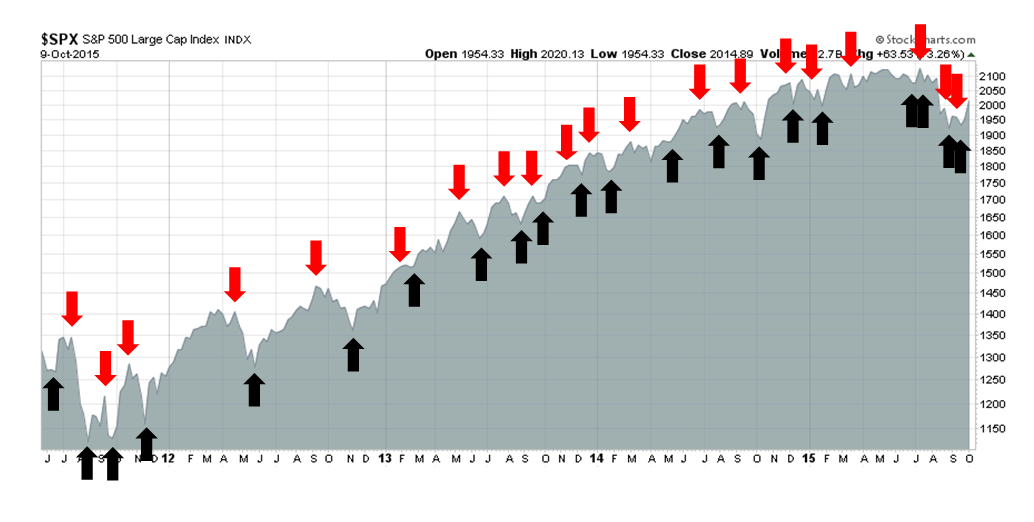
My inner trader uses the trading model component of the Trend Model seeks to answer the question, "Is the trend getting better (bullish) or worse (bearish)?" The history of actual out-of-sample (not backtested) signals of the trading model are shown by the arrows in the chart below.
Update schedule: I generally update Trend Model readings on weekends and tweet any changes during the week at @humblestudent.
A washed-out market
Back in the day when I was a long-only equity portfolio manager, the market would occasionally get hit with emerging market crises. On one occasion, I can remember being in investment meetings discussing how to tweak our stock picking quant models in light of such an event. A manager on the emerging market team made the astute comment that you couldn't possibly model the stocks in a country undergoing a crisis based on anything but technical analysis. At inflection points, it is the technical factors that start working first, followed by fast moving fundamental models like estimate revision, then fundamental factors like growth and value.
I remember that insight well and it was based on those comments that after 9/11 I moved my quantitative equity market-neutral portfolio to an all-cash position. I recognized that no quant model was going to work very well in that situation. The fundamental ratios would be all outdated and no sane person would trade off them, but no one quite knew what earnings estimates were until the dust had settled.
I believe that we are at a similar kind of turning point in the market, but on the upside. Market psychology can be revealing, especially when it rallies in the face of bad news. We saw that when stocks rose on the news of a highly negative Employment Report. We saw a similar reaction last Thursday, when German trade figures came in below expectations but the DAX Index ended the day in the green.
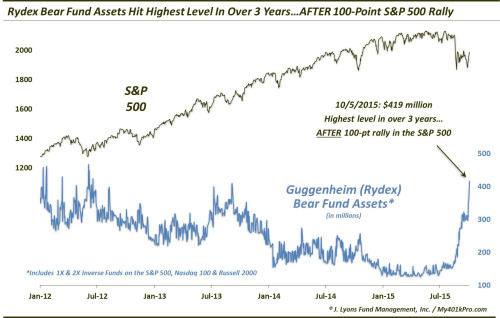
The (contrarian) negative psychology was exemplified by the behavior of Rydex investors, who added to their crowded short during the initial stages of the recent rally (via Dana Lyons):
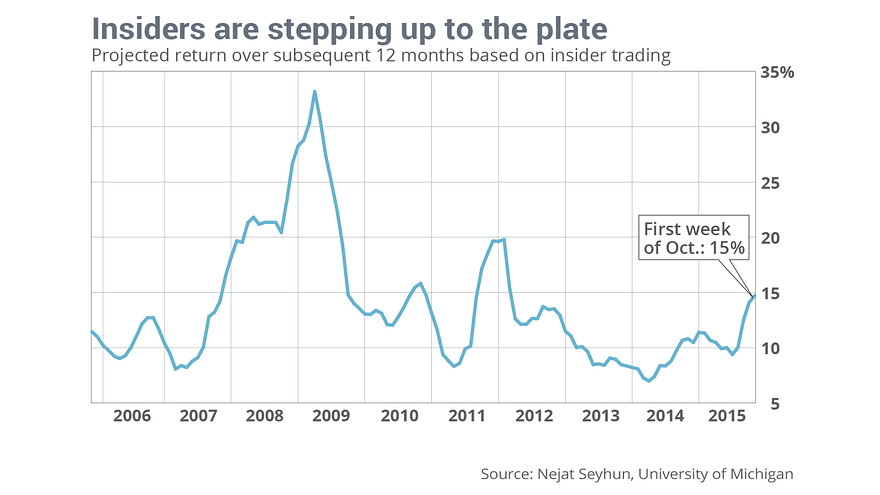
At the same time, Mark Hulbert reports heavy insider buying and models indicate a 12-month return of 15%:
By contrast, coincidental indicators such as forward EPS estimates continue to decline (via John Butters of Factset, annotations in red are mine):
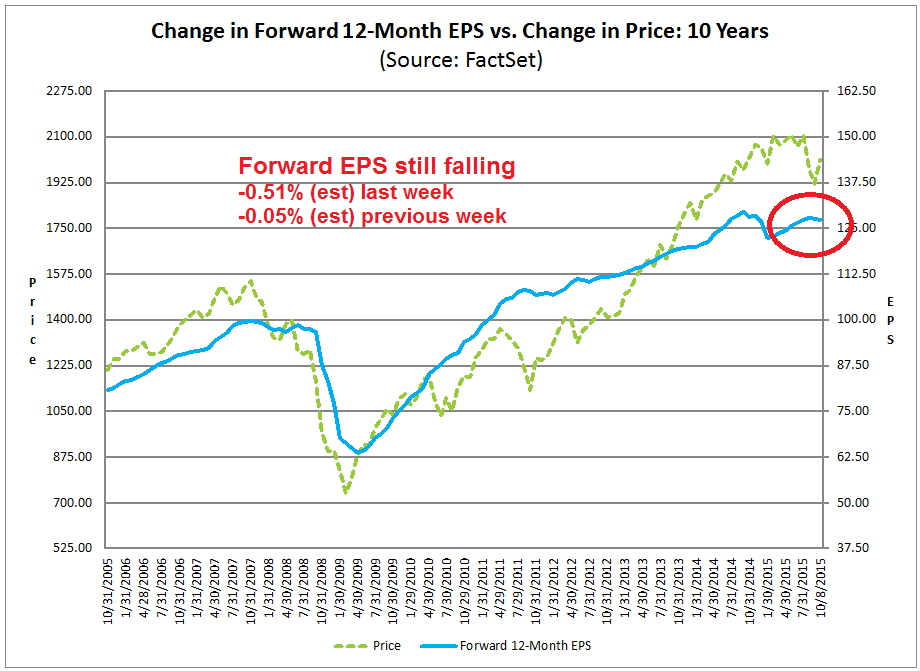
This kind of market environment, where sentiment is contrarian bullish and stocks rally in the face of bad news, are the the classic signs of a washed-out market.
The best fundamental and macro explanation of the current environment is that Mr. Market is looking over the valley of near-term weakness to better times ahead. New Deal democrat, who monitors high frequency economic releases and divides them into long leading, short leading and coincidental indicators, finds evidence of near term weakness but no warnings of recession from long leading indicators:
Among long leading indicators, interest rates for corporate bonds and treasuries remained neutral. Mortgage rates, and purchase and refinance mortgage applications are positives. Real estate loans are positive. Money supply is positive.
Among short leading indicators, the interest rate spread between corporates and treasuries remains quite negative, as is the US$. Positives included jobless claims, oil and gas prices, and gas usage. Commodities remain a big global negative. Temporary staffing is negative for the 21st week in a row, and more intensely so for the 3rd straight week.
Among coincident indicators, steel production, shipping, rail transport ex-intermodal, the TED spread and LIBOR all are negative. Tax withholding and consumer spending are weakly positive.
The only changes this week were that October's tax withholding got off to a poor start, and railroad got slightly weaker. Aside from that, the story remains the same as recently. Consumer-related indicators - mortgages, oil and gas, jobless claims, and consumer spending - all remain positive. But those portions of the US economy most exposed to global forces, including the US$, commodities, and industrial production and transportation, are all firmly negative. Employment on net is still a positive, though more weakly so. The US economy is clearly importing weakness, but not enough to overcome domestic positives.
New Deal democrat's conclusion is we have a picture of near-term weakness from abroad, but recovery later and no signs of a recession next year. Should investors be focusing on the bad news today, or the good news tomorrow?
Signs of global healing
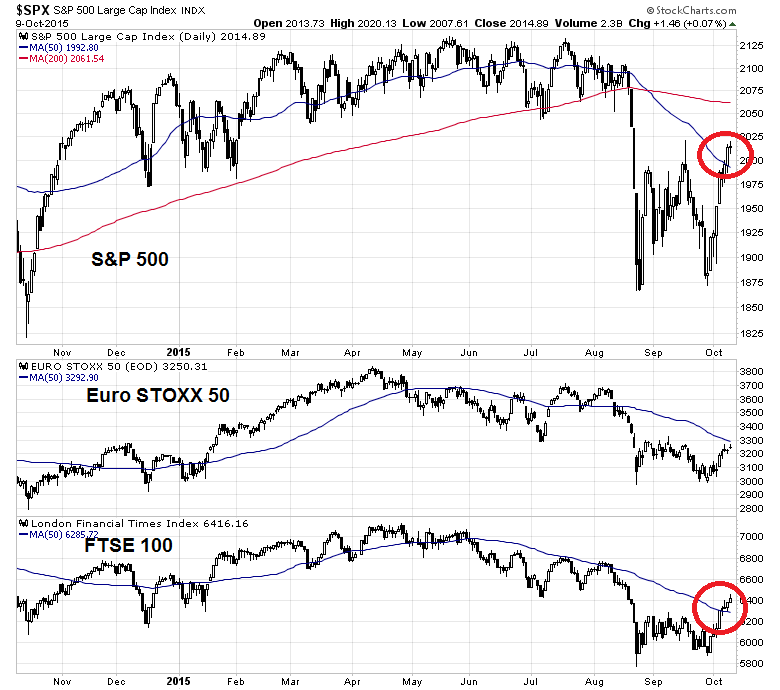
Even outside the US, global equities remain upbeat in the face of this bad news. This chart of US (via S&P 500), UK (via FTSE 100) and European stocks show that only the Euro Stoxx 50 has not rallied and regained its 50 day moving average.
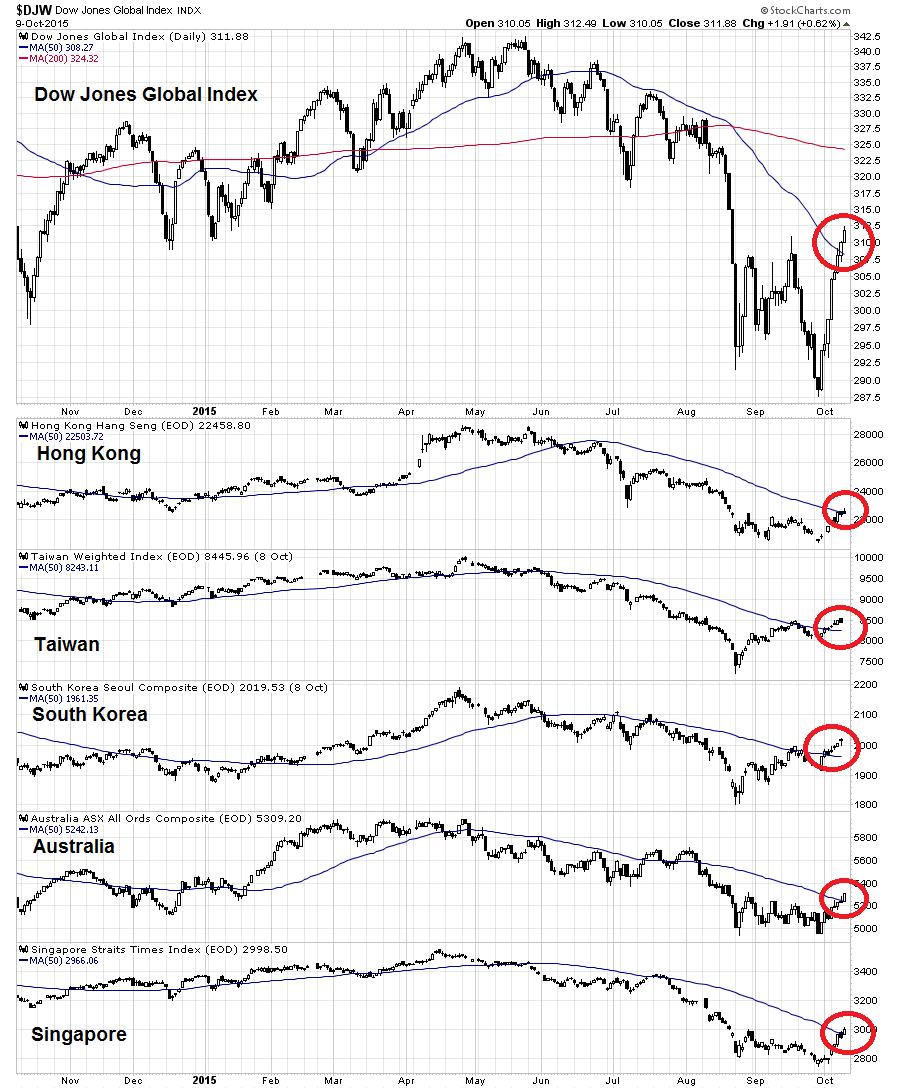
What about China, which was the source much recent market angst? This chart of global stocks via the Dow Jones Global Index (top panel) and the stock indices of major Asian markets (Hong Kong, Taiwan, South Korea, Australia and Singapore) that are China`s biggest regional trading partners show that they have all regained their 50 dma.
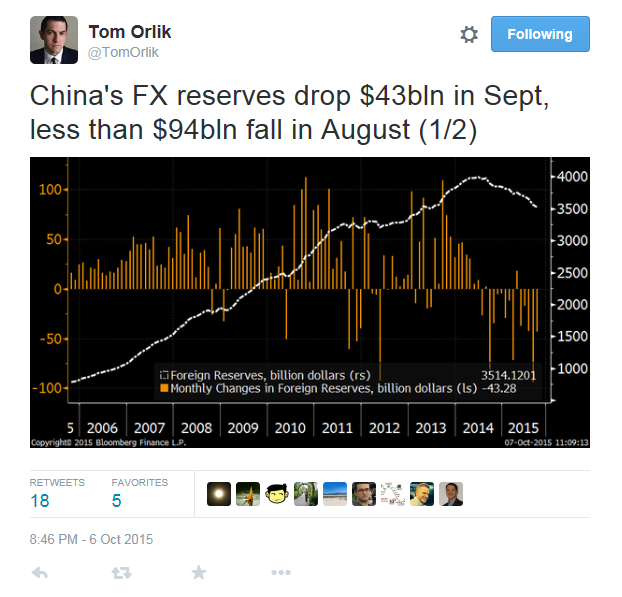
Within China itself, Tom Orlik of Bloomberg highlighted the following signs of healing. Capital flight has slowed:
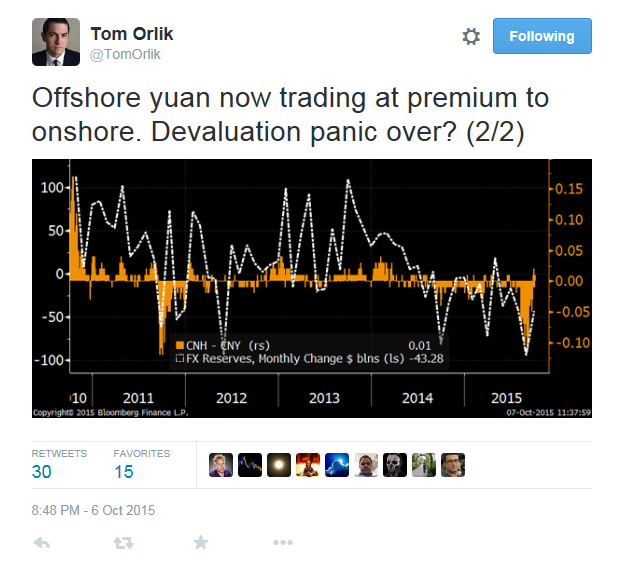
...and the spread between the offshore and onshore yuan is reversed itself, indicating that RMB selling pressure has abated:
Even Moody`s was upbeat about the Chinese property market, which has been the source of much financial stress:
Sales growth of China's real estate market will remain resilient for the rest of 2015, according to rating agency Moody's."We expect our rated developers to launch more projects for sale and take advantage of the current strong sales momentum," said Stephanie Lau, a Moody's assistant vice president and analyst.
Sales value of commercial housing in the first eight months went up 15.3 percent year on year to 4.8 trillion yuan (755 billion U.S. dollars). The growth rate was 1.9 percentage points higher than that in the first seven months, indicating nascent signs of recovery, according to the National Bureau of Statistics (NBS).
Moody's attributed the growth mainly to the supportive monetary and regulatory policies implemented since the second half of 2014.
Watching the USD for confirmation
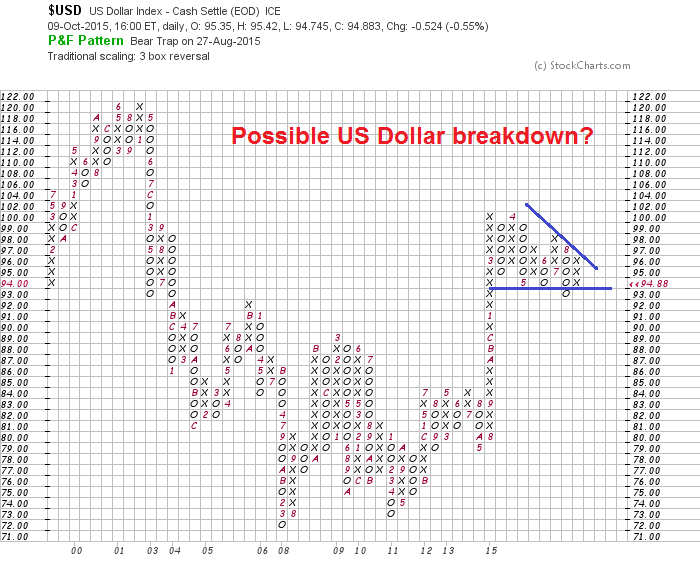
Buying equities here is not without risk. As we enter Q3 earnings season, the market is likely to be subject to be near term volatility based on the earnings reports of the day. Looking forward, however, one of the keys to the earnings outlook is the US dollar, which is starting look like it`s breaking down on a technical basis. Should the USD weaken further, it would boost the earnings of US companies operating overseas.
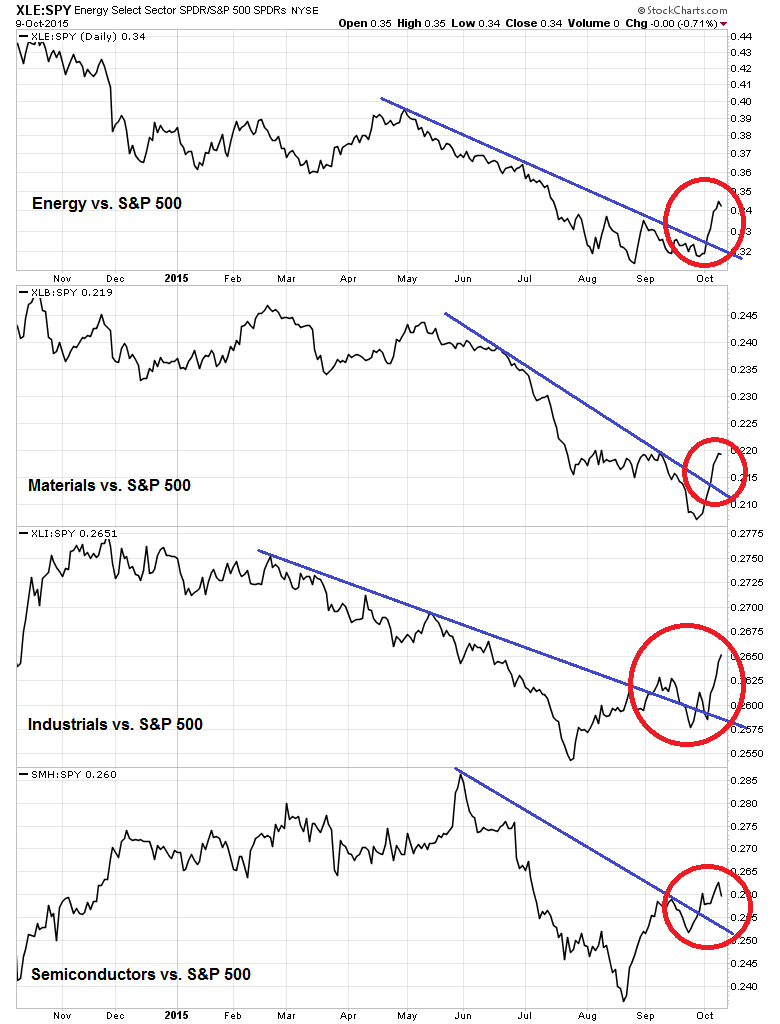
Market leadership is already anticipating further USD weakness. The market leaders (via Energy Select Sector SPDR (N:XLE), Materials Select Sector SPDR (N:XLB), Industrial Select Sector SPDR (N:XLI), and Market Vectors Semiconductor (N:SMH)) have been cyclical stocks, which would be beneficiaries of greenback weakness.
To a large extent, the near-term fate of the dollar depends much on Fed policy. Should we get dovish noises from the Fed at their next FOMC meeting, then it will put downward pressure on the USD. If, on the other hand, the market perceives that the probability of a December rate hike is rising, then dollar bulls will have the wind at their backs. Right now, the consensus is that the chances of a December liftoff are fading, which is negative for the USD and positive for the earnings outlook of large cap US multi-nationals.
The Zweig Breadth Thrust clincher
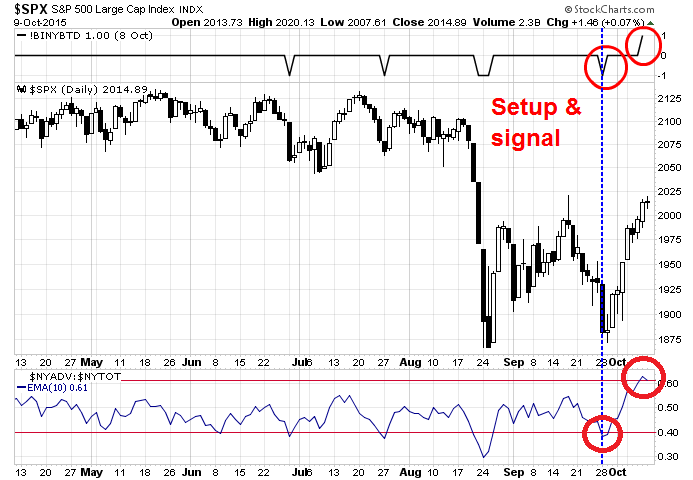
For my inner investor, the bullish clincher was the sudden appearance of the Zweig Breadth Thrust on Thursday (see Bingo! We have a buy signal!). Further analysis of the post-WW II performance of this signal has been unabashedly bullish indicating only minor downside risk and high upside potential (see The Zweig Breadth Thrust as a case study in quantitative analysis).
As a consequence, my inner investor has moved from a cautious "accumulate on weakness" to a "what`s the credit limit on my VISA card" buy (with staggered stops at the SPX 1900-1950 range).
Watching for pullback and consolidation
My inner trader, on the other hand, is not as enthusiastically bullish for the next couple of days. Though the ZBT is a longer term bullish signal, the market is very overbought today, as shown by the % of stocks above their 10 dma (via IndexIndicators).
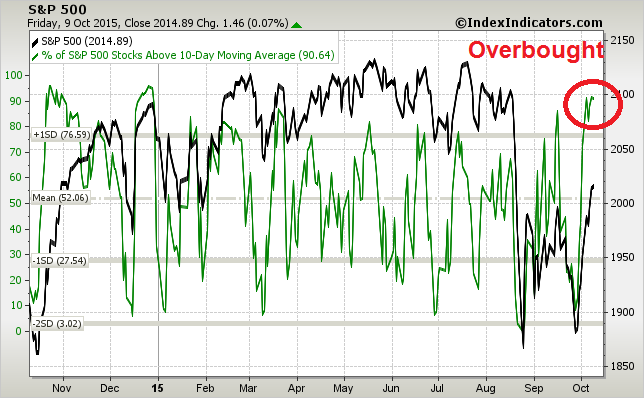
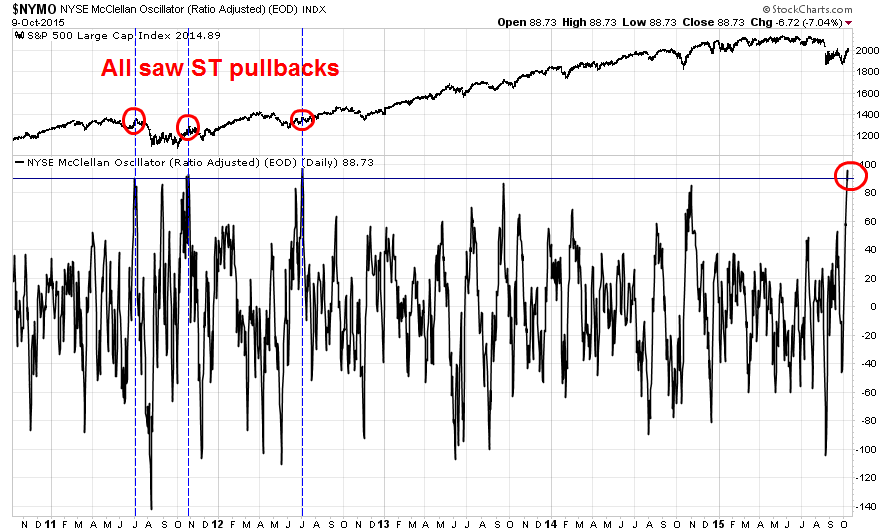
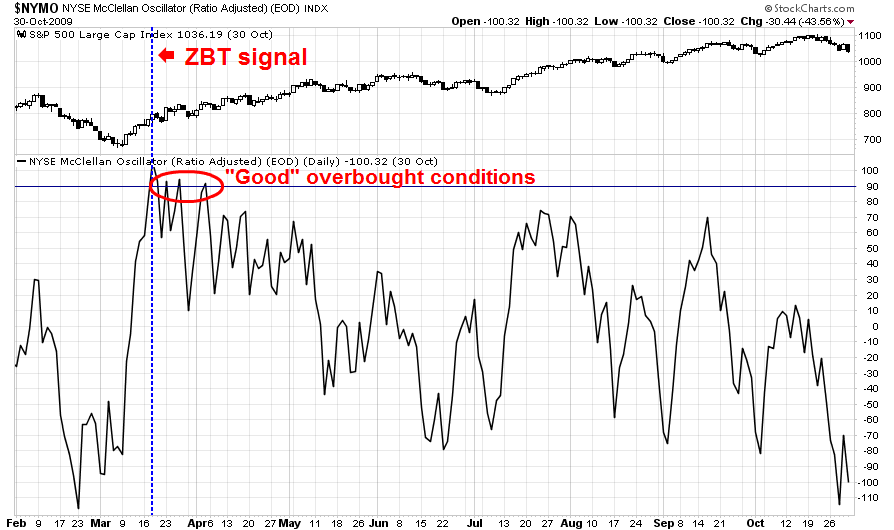
Moreover, the NYSE McClellan Oscillator moved above 90 last week, which is a rare event and signaled near-term weakness in the past.
We saw the same effect at the then 2009 bottom, when NYMO surged above 90. That event, incidentally, coincided with the ZBT buy signal. The market pulled back for two days and went on to rally and flash a series of "good" overbought readings indicating rising underlying buying power.
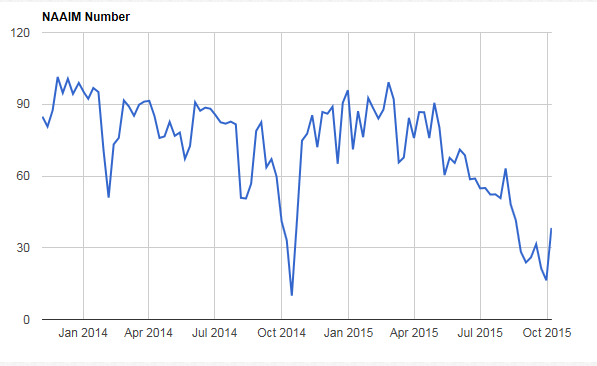
Indeed, with NAAIM sentiment still overly cautious and Rydex investors in a crowded short, the market could be setting up for a FOMO (Fear of Missing Out) rally later this month.
My inner trader is biding his time and he will be averaging into his long positions in the next few days, hopefully on weakness. While he is tactically cautious right now, he agrees with my inner investor that we are on the verge of a "what`s the credit limit on my VISA card" buy signal.
Disclosure: Cam Hui is a portfolio manager at Qwest Investment Fund Management Ltd. (""Qwest""). This article is prepared by Mr. Hui as an outside business activity. As such, Qwest does not review or approve materials presented herein. The opinions and any recommendations expressed in this blog are those of the author and do not reflect the opinions or recommendations of Qwest.
None of the information or opinions expressed in this blog constitutes a solicitation for the purchase or sale of any security or other instrument. Nothing in this article constitutes investment advice and any recommendations that may be contained herein have not been based upon a consideration of the investment objectives, financial situation or particular needs of any specific recipient. Any purchase or sale activity in any securities or other instrument should be based upon your own analysis and conclusions. Past performance is not indicative of future results. Either Qwest or Mr. Hui may hold or control long or short positions in the securities or instruments mentioned."

