- The stock market has kicked off the year in correction mode.
- Meanwhile, the US dollar has had its best start to a year in a while.
- While history suggests a poor start to the year translates into a poor end, analysts' optimistic predictions disagree.
- Looking to beat the market in 2024? Let our AI-powered ProPicks do the leg work for you, and never miss another bull market again. Learn More »
Breaking its longest winning streak in nearly two decades, the S&P 500 experienced a downturn for the first time in ten weeks last week.
The catalyst behind this reversal was the release of the jobs report on Friday, which tempered expectations for swift and substantial interest rate cuts by the U.S. Federal Reserve.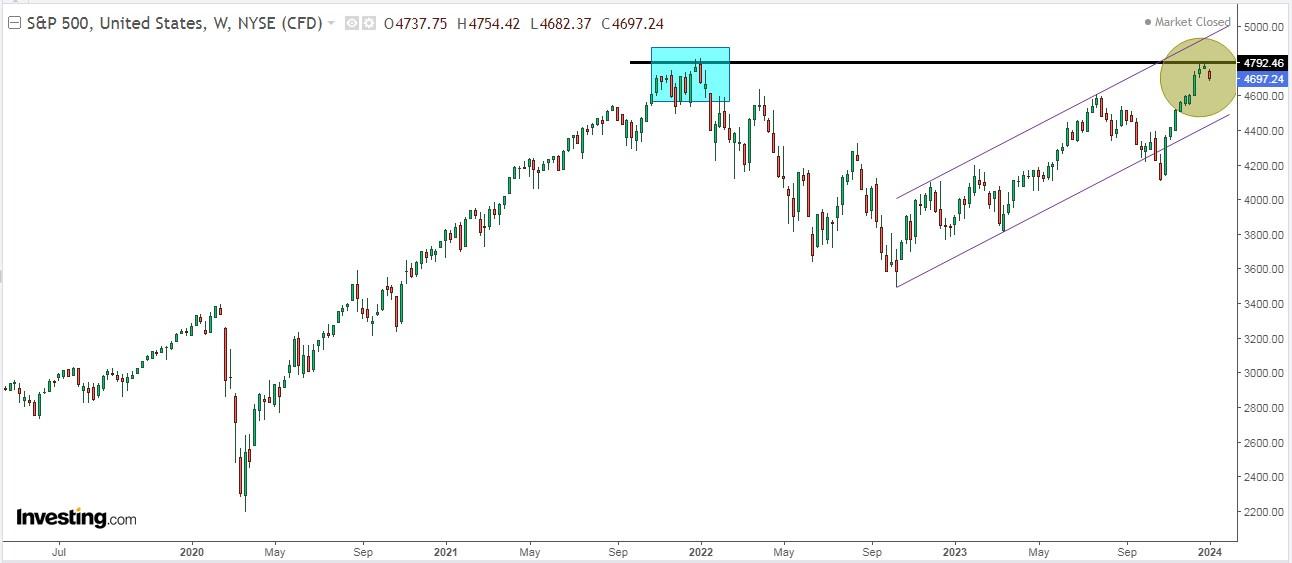 As a matter of fact, the amount of historical data pointing towards a meager year of stock market returns keeps mounting by the day.
Let's check out a few patterns below:
1. The customary Santa Claus rally failed to materialize last December. During this period, the S&P 500 declined by -1%, the Nasdaq by -2.6%, with the Dow Jones managing a marginal uptick of +0.1%, marking the market's worst performance on the final week of the year since 2015-2016, ending a seven-year streak of strong showings.
2. Another notable pattern is the performance of the first five trading sessions of the year, often seen as an indicator of the market's trajectory for the rest of the year.
Despite its seemingly arbitrary nature, historical data reveals a 69% correlation over the last 73 years between the market's performance in the first five trading sessions and the entire year.
3. In election years, like 2024, this correlation increases to 83%, having been fulfilled on 14 out of 16 occasions in the last election years.
When the S&P 500 recorded gains in these initial five days, the average return for the year stood at +14.2%. Conversely, when the index's performance in these days was negative, the average return for the year dropped to +0.3%.
4. The average yearly correction from high to low in the S&P 500 has been +14.2% since the 1980s. In 2023, the correction was +10.3%, yet the index concluded the year with a gain of over +24%. This underscores the importance of maintaining peace of mind and exercising patience. Could we be in for another correction this year?
What Are Analysts Banking on?
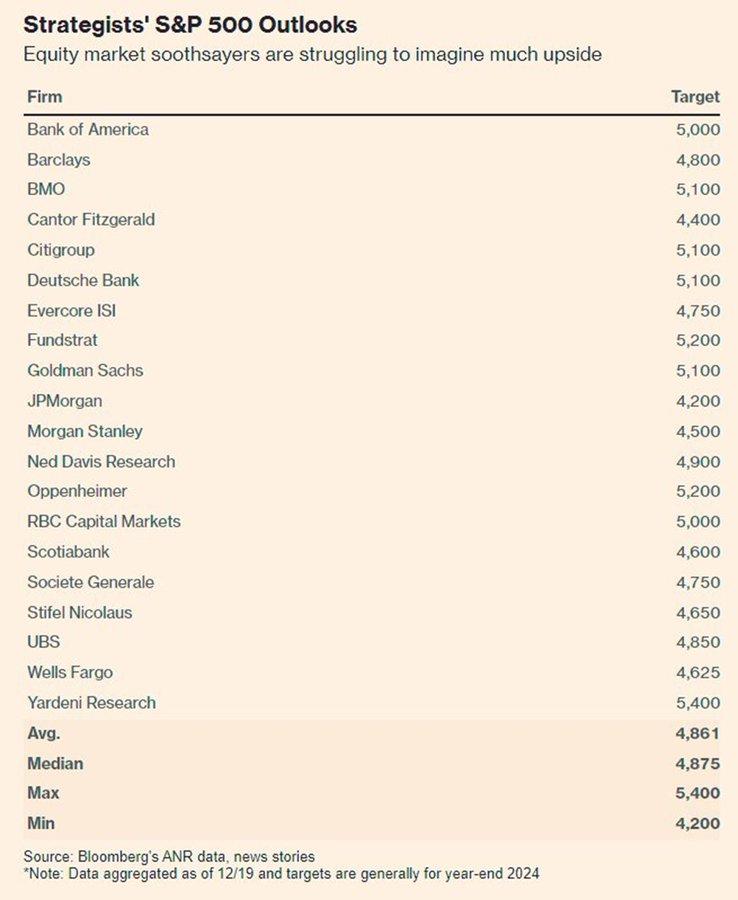
Let's take a look at analyst projections to understand a little better where we are now.
JP Morgan takes a more conservative stance, anticipating it at 4200 points, while Yardeni Research adopts a more bullish outlook, predicting 5400 points.
The substantial 1400-point difference between these projections highlights the diverse expectations among market analysts.
US Dollar's Best Start to the Year Since 2015
The U.S. dollar (DXY) ended the week at 102.3, marking its best first-four-day performance in a year since 2015 when it was up +1.9%.
- 2015: +1,9%
- 1991: +2%
- 2011: +2,2%
- 1988: +2,8%
- 2005: +2,9%
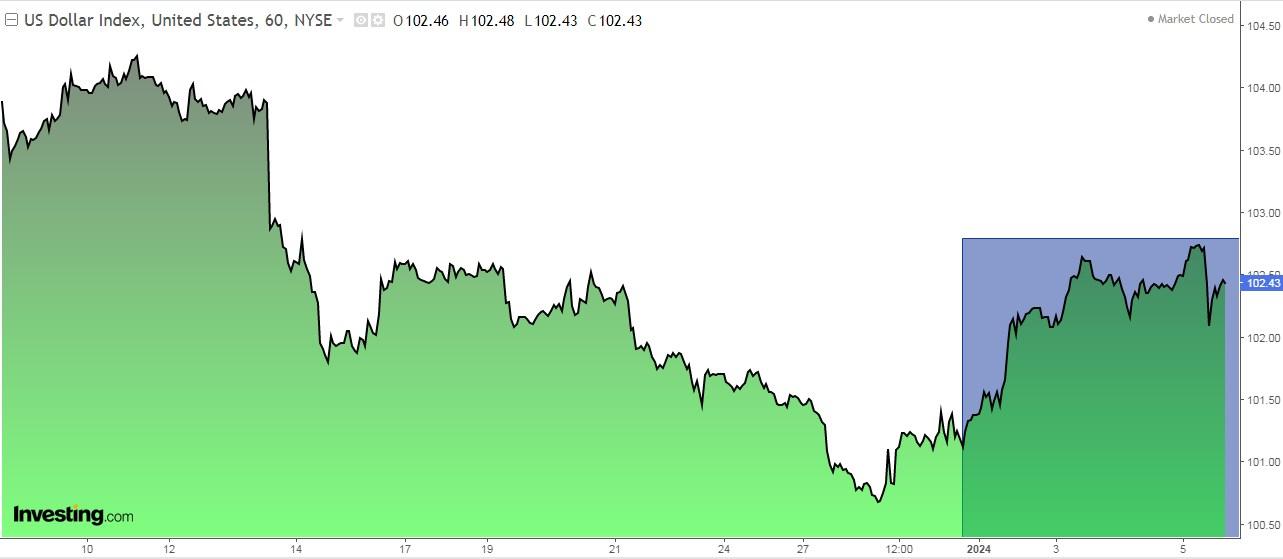
And that's not all, it was its best week since last November 10.
The first week's gains come after a disappointing year for the dollar, which plunged in late 2023 as the Federal Reserve planned three rate cuts next year, and investors discounted more.
The index, which has a higher weighting against the euro, fell -2.1% last year after rising +7.9% in 2022.
Earthquake Sinks the Yen
The yen ended its worst week against the U.S. dollar in 16 months as the economic fallout from the tremendous earthquake that struck the country limited the likelihood that the Bank of Japan will soon remove negative interest rates.
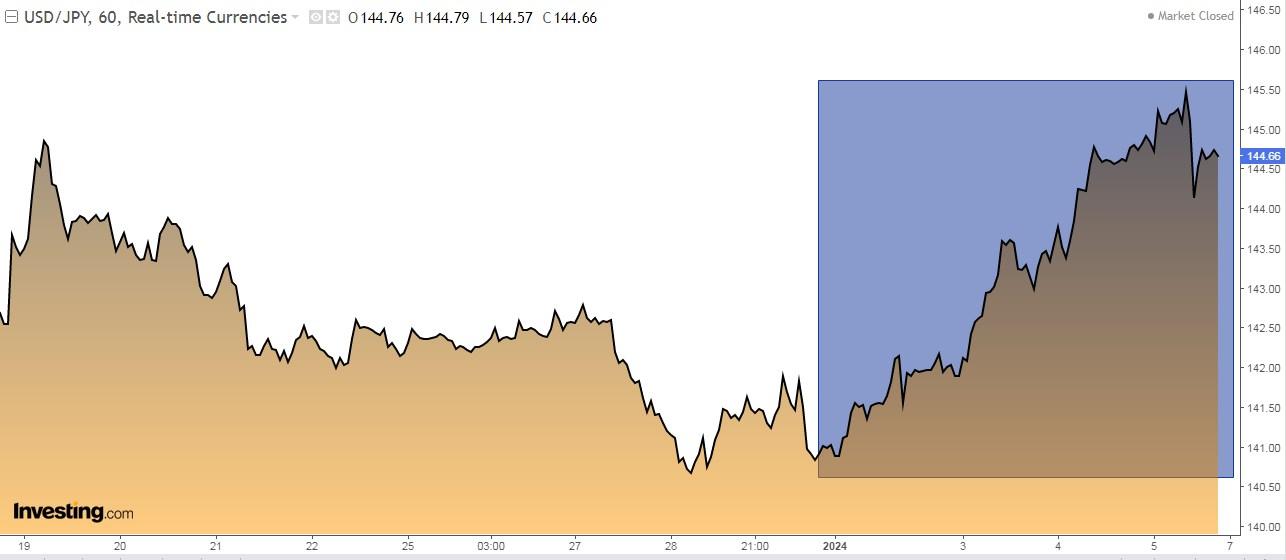
The USD/JPY pair rose +2.6% on the week to the highest level in more than three weeks.
Previously, markets were mulling over the possibility that negative rates could be removed as soon as this month. It is now a given that this will not be the case.
Bitcoin Funds Fees Revealed
Bitcoin could hit an all-time high in 2024, with the potential to end the year at around $80,000. That's what Wall Street expects. The price of the cryptocurrency will likely rise this year for the following reasons:
- The possible approval of an exchange-traded fund that invests directly in bitcoin. The market expects the SEC to allow it and give the green light as soon as January 10.
- Halving in April, a fact that has always driven Bitcoin sharply higher.
- Growing demand.
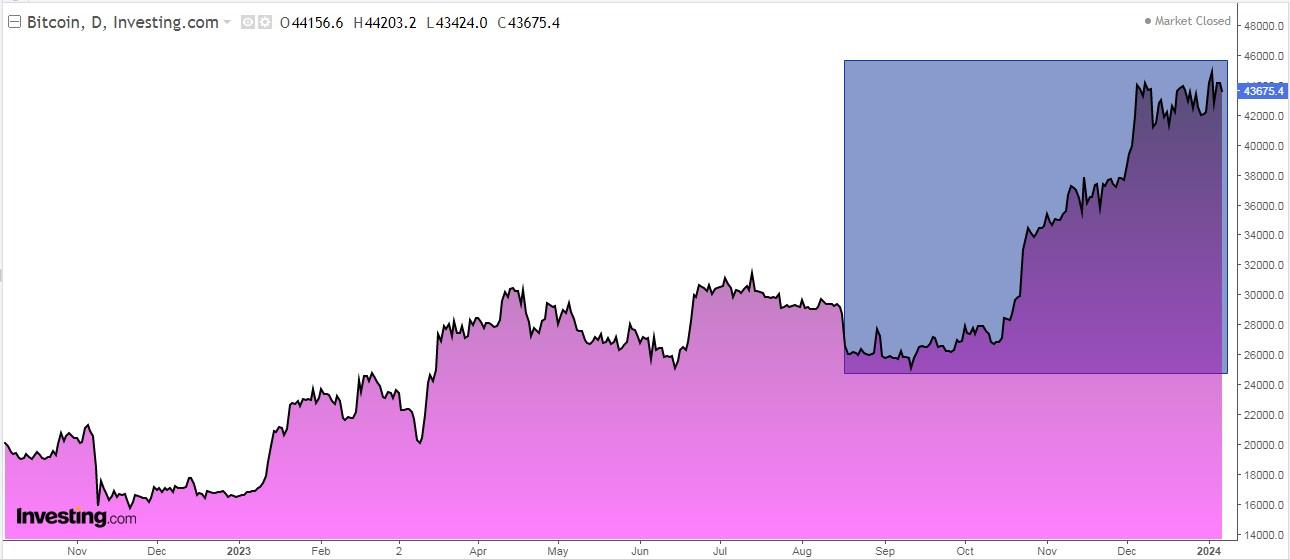
Bitcoin rallied more than +150% in 2023 and started 2024 reaching its highest level since April 2022. Even so, it is still far from its all-time high of $68,990 set in 2021.
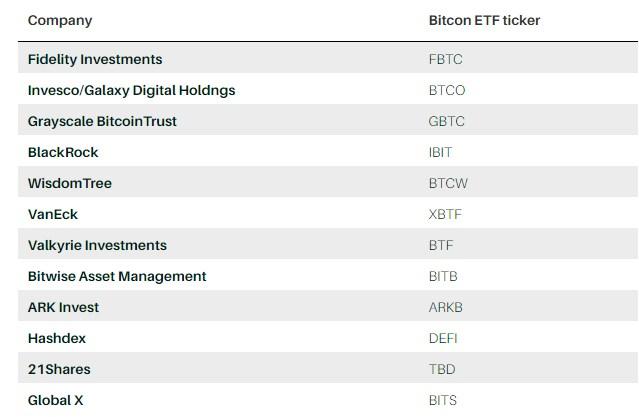
Well, we have now started to learn what fees those new Bitcoin ETFs will have.
Fidelity said its Wise Origin Bitcoin ETF will charge +0.39% annually. Invesco plans to charge +0.59% for their Invesco Galaxy Bitcoin ETF, though the fee will be waived for six months on the first $5 billion in assets.
In the table below you can see the list of funds with their corresponding ticker.
Stock Market Rankings 2024
This is the ranking of the main stock markets so far in 2024:
- Ibex 35 Spanish +0.62%.
- FTSE MIB Italian +0.29%.
- Nikkei Japanese -0.26%.
- FTSE 100 British -0.56%
- Dow Jones -0,67%
- Dax -0,94%
- Euro Stoxx 50 -1,28%
- S&P 500 -1.52%
- Cac -1,62%
- Nasdaq -2,5%
Investor Sentiment (AAII)
Bullish sentiment, i.e. expectations that stock prices will rise over the next six months, increased 2.2 percentage points to 48.6% and remains above its historical average of 37.5%.
Bearish sentiment, i.e., expectations that stock prices will fall over the next six months, decreased 1.6 percentage points to 23.5%. Bearish sentiment is below its historical average of 31%.
***
In 2024, let hard decisions become easy with our AI-powered stock-picking tool.
Have you ever found yourself faced with the question: which stock should I buy next?
Luckily, this feeling is long gone for ProPicks users. Using state-of-the-art AI technology, ProPicks provides six market-beating stock-picking strategies, including the flagship "Tech Titans," which outperformed the market by 670% over the last decade.
Disclaimer: This article is written for informational purposes only; it does not constitute a solicitation, offer, advice, counseling or recommendation to invest as such it is not intended to incentivize the purchase of assets in any way. As a reminder, any type of asset is evaluated from multiple perspectives and is highly risky, and therefore, any investment decision and the associated risk remains with the investor.

