By Chuck Mikolajczak
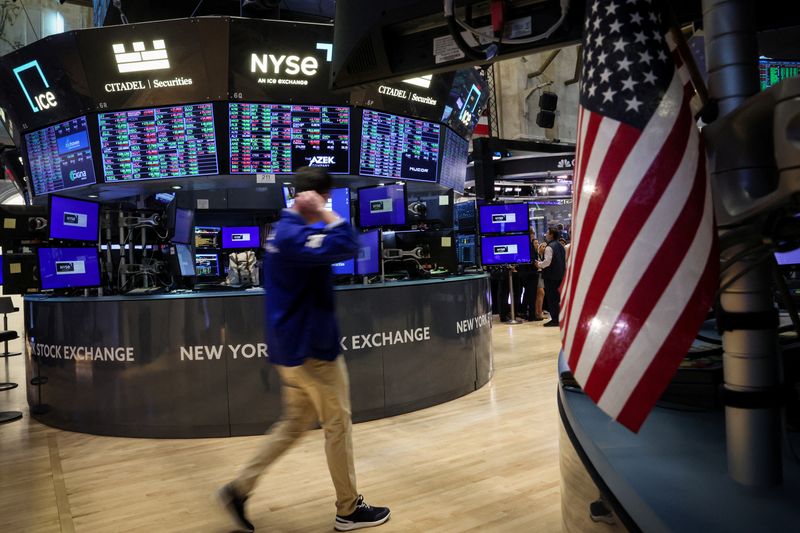
NEW YORK (Reuters) -U.S. stocks sold off for a second straight session on Friday, and the Nasdaq Composite confirmed it was in correction territory after a soft jobs report stoked fears of an oncoming recession.
The Labor Department said nonfarm payrolls increased by 114,000 jobs last month, well short of the 175,000 average forecast by economists polled by Reuters, and the at least 200,000 that economists believe are needed to keep up with population growth. The unemployment rate jumped up to 4.3%, near a three-year high.
The data added to concerns the economy was slowing more rapidly than anticipated and the Federal Reserve had erred by keeping rates steady at its policy meeting that concluded on Wednesday.
Expectations for a rate cut of 50 basis points (bps) at the Fed's September meeting jumped to 69.5% from 22% in the prior session, according to CME's FedWatch Tool.
"Obviously the jobs number is the big headline, but we seem to have officially entered at least a rational world where bad economic news is read as bad rather than bad economic news is read as good," said Lamar Villere, portfolio manager at Villere & Co. in New Orleans.
"The Fed is going to cut and we're all sort of adjusted to that, that is sort of established. Now it's more like hey, did they wait too long? Do we have a recession on our hands?"
The weak jobs data also triggered what is known as the "Sahm Rule," seen by many as a historically accurate recession indicator.
The Dow Jones Industrial Average fell 610.71 points, or 1.51%, to 39,737.26, the S&P 500 lost 100.12 points, or 1.84%, to 5,346.56 and the Nasdaq Composite lost 417.98 points, or 2.43%, to 16,776.16.
Adding downward pressure was drop in Amazon (NASDAQ:AMZN) , down 8.79%, and Intel (NASDAQ:INTC) , which plunged 26.06% after their quarterly results and disappointing forecasts.
The declines pushed the Nasdaq Composite down more than 10% from its July closing high to confirm the index is in a correction after concerns grew about expensive valuations in a weakening economy.
The S&P 500 closed at its lowest level since June 4. Both the benchmark S&P index and the blue-chip Dow suffered their biggest two-day slides since March 2023.
The small cap Russell 2000 index slumped 3.52% to close at a three-week low and saw its biggest two-day drop since June 2022.
Chip stocks also continued their recent downdraft, and the Philadelphia SE Semiconductor Index closed at a three-month low after its biggest two-day slide since March 2020.
Among the few bright spots, Apple (NASDAQ:AAPL) rose 0.69% after posting better-than-expected third-quarter iPhone sales and forecasting more gains, betting on AI to attract buyers.
Of the 11 major S&P 500 sectors, defensive names such as consumer staples, utilities and real estate were the only advancers, with the consumer discretionary sector leading declines as Amazon weighed heavily, for its biggest two-day drop since June 2022.
The CBOE Volatility index, also known as Wall Street's "fear gauge," breached its long-term average level of 20 points to touch 29.66 its highest mark since last March 2023, before closing at 23.39.
Some market participants viewed the sell off as a chance to pickup stocks at cheaper prices. UBS strategist Jonathan Golub said in a note to clients on Friday that market returns are greatest when the VIX is extended and represents a near-term buying opportunity.
Declining issues outnumbered advancers by a 2.92-to-1 ratio on the NYSE, and by a 4.52-to-1 ratio on the Nasdaq.

The S&P 500 posted 62 new 52-week highs and 15 new lows, while the Nasdaq Composite recorded 34 new highs and 297 new lows.
Volume on U.S. exchanges was 14.75 billion shares, compared with the 11.97 billion average for the full session over the last 20 trading days.