I was 'out-of-office' on Thursday when the bears came in and ripped up Wednesday's recovery gains. Friday saw some indices give up a little more but the damage was done the day before.
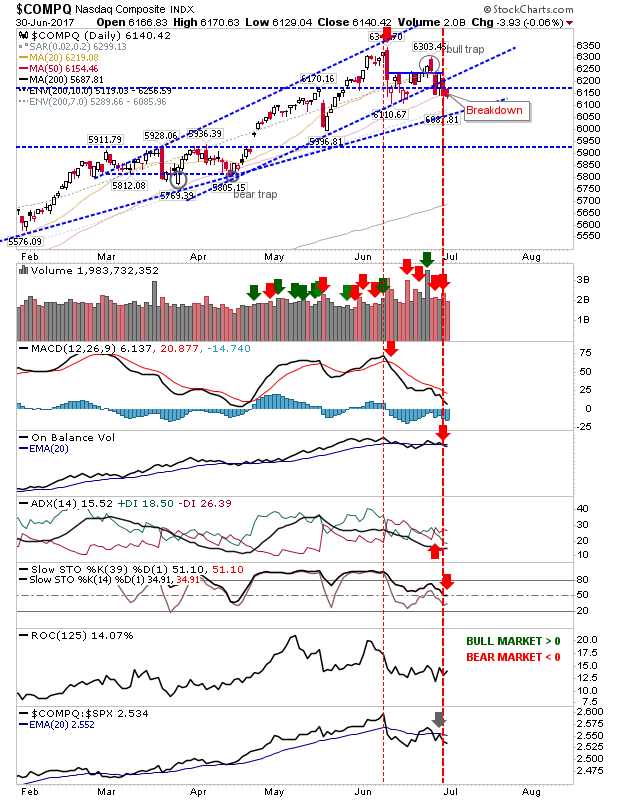
The NASDAQ effectively confirmed the channel breakdown and kept the June 'bull trap' in play. The 50-day MA was undercut but there is room to recover today, Monday. Technicals finished last week net bearish. Friday's action sets up a move to the slower rising trendline.
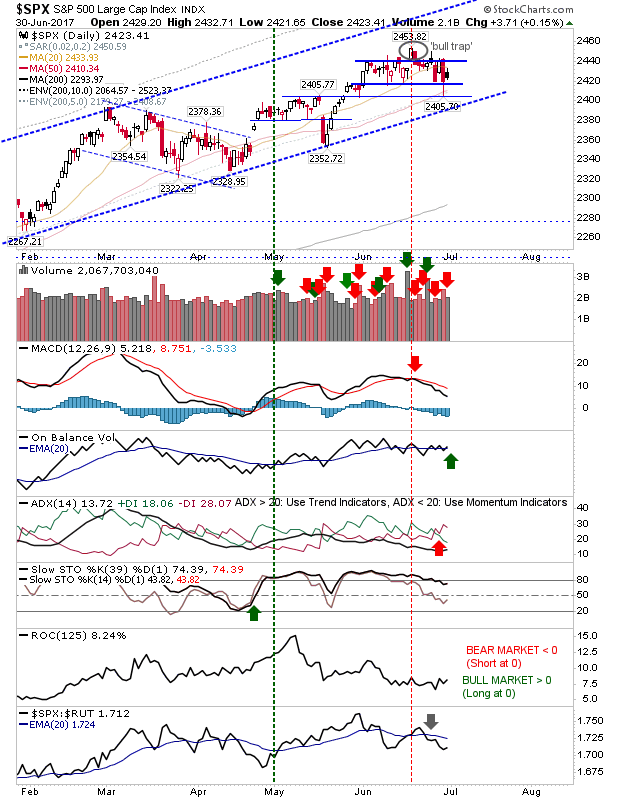
The S&P fell back inside the prior trading range and is hanging on to the latter support. A small consolidation was an uptick in On-Balance-Volume - although it has been whipsawing across the trigger line for a few weeks.
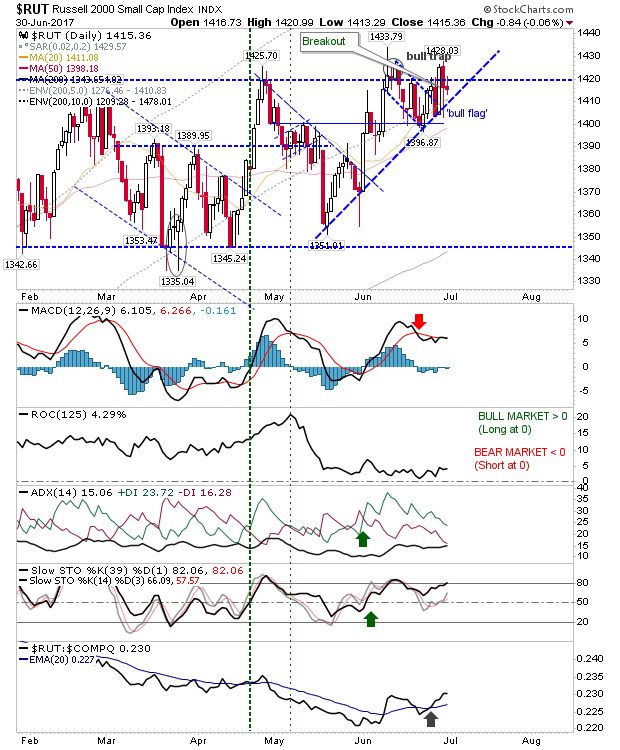
The Russell 2000 actually fared relatively well. The index finished with a narrow doji after dropping inside the consolidation on Thursday's reversal. The rising trendline is still holding, but the index is getting squeezed between this support and consolidation resistance. I still think this is going to push higher and lead markets into the Fall but it's running out of room for which it can do this.
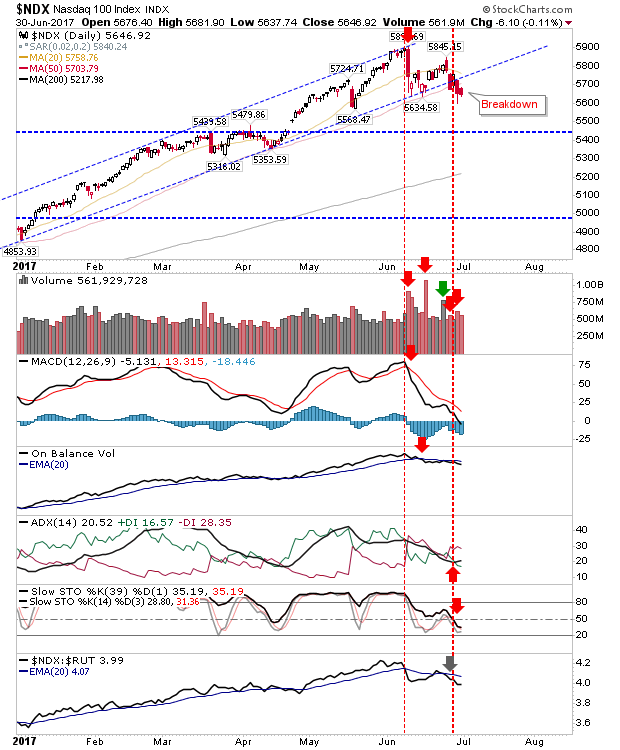
The NASDAQ 100 experienced a clean channel break after a very by-the-book rally. The index lost its 50-day MA and is now looking at its 200-day MA as its next support (a long way down). Technicals are net bearish but not oversold - another reason to think this could go lower before recovering some of its lost ground.
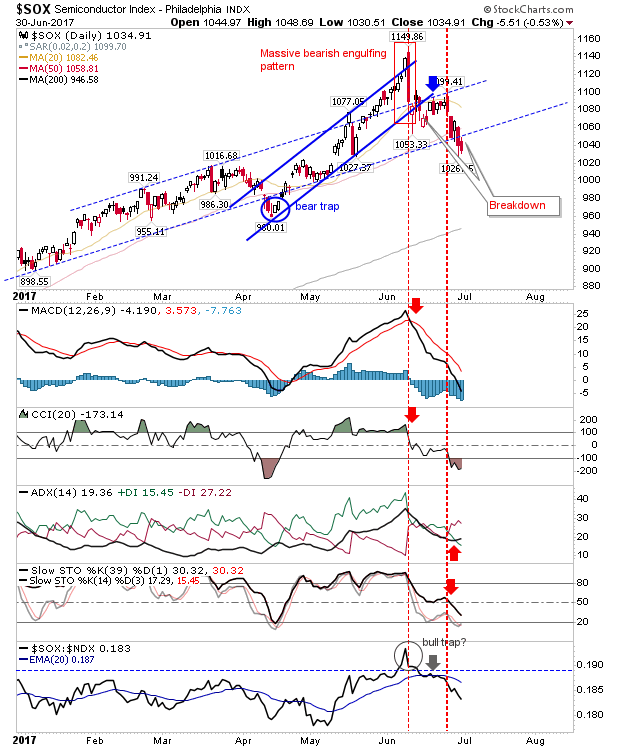
The Semiconductor Index also gave up support of the slower channel after coming unstuck from the faster channel with the sizable bearish engulfing pattern. Of the indices I watch, it's the weakest. Shorts will be raising their profits but it will soon be oversold enough to see a squeeze-worthy bounce.
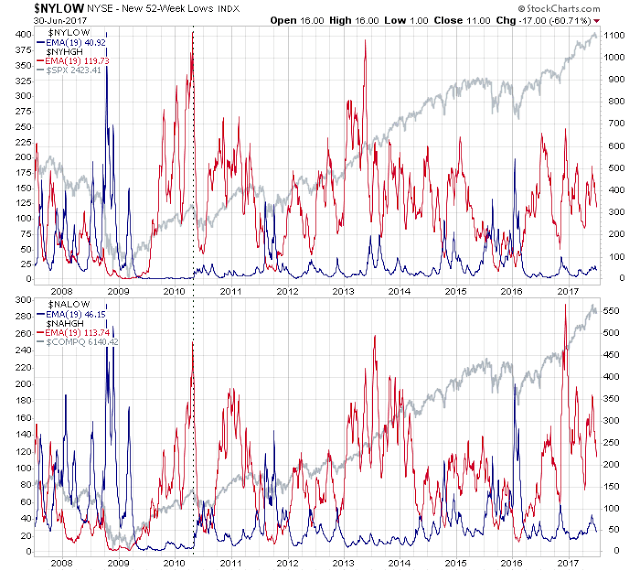
The number of new highs has been spiking in a fashion similar to 2010/2011/2013 (while new lows flatlined) but this hasn't always been a marker for a top as was the case in 2013. It's worth watching, but be wary of commentators overstating its importance.
For early this week, watch for a bounce; the extent of the bounce will determine how much demand (and appetite) there is from bulls to defend these market valuations. Investors haven't got enough to be scared out of profit or be oversold enough to generate a buy. Traders trade and take their chances as they may.
