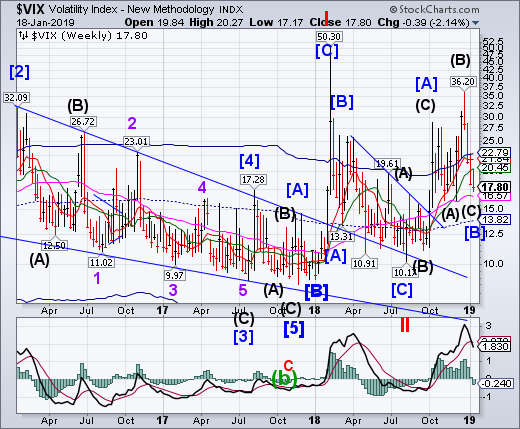
VIX declined toward long-term support at 16.57, extending its Master Cycle low on Friday.The Cycle low put a new outlook on the Model, suggesting that these moves may be at a higher degree Cycle than originally thought.
Some of the nimblest hedge-funds that trade volatility are hoping history doesn’t repeat after suffering their worst year in over a decade.
Managers famed for posting steady profits from relative-value strategies, which shuffle between long- and short-volatility bets, lost a record 2.5 percent in 2018, according to CboeEurekahedge data.
You’d think funds that profit from swings would thrive from crazed markets. But these rarefied players were sunk instead by erratic moves in implied volatility and an outsized spike in U.S. equity angst versus the rest of the world. (Bloomberg)
SPX Rallies To Intermediate-Term Resistance
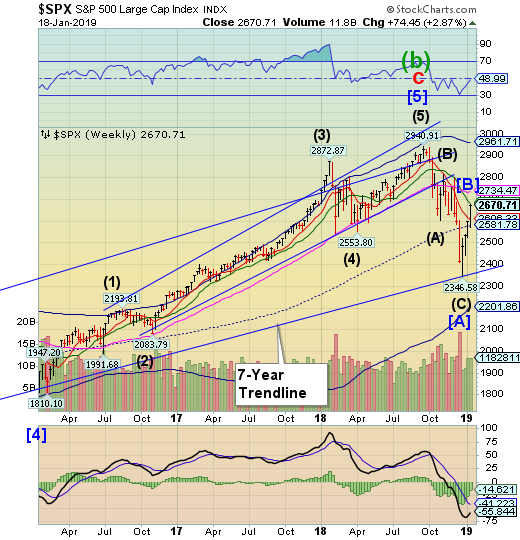
SPX extended its rally to testIntermediate-term resistance at 2680.03. It has met the 50% retracement of its decline at 2644.00. Thus far it has been 16 market days from the December 26 low.
Stocks in the U.S. and Europe jumped Friday as renewed hopes for progress in trade talks between the U.S. and China helped the markets finish the week with another strong gain.
Indexes jumped after Bloomberg News reported that China's government offered to buy more goods and services from the U.S., potentially eliminating its trade deficit by 2024. For investors, the encouraging news on trade builds on recent positive signs for the U.S. economy and indications from the Federal Reserve that it will be patient when considering future interest rate hikes.
The Dow Jones Industrial Average is up 5.9 percent and the S&P 500 index has risen 6.5 percent so far this year, a surprisingly strong showing coming off a punishing end to 2018. (ABCNews)
NDX Meets Intermediate-Term Resistance
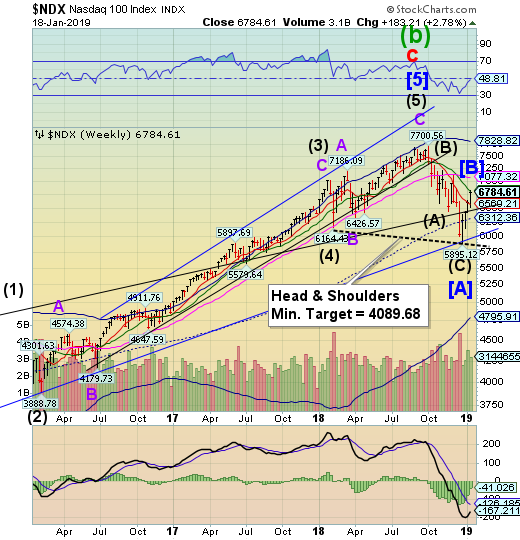
NDX continued its rally toward Intermediate-term resistance at 6814.12. The Cycles Model suggests that NDX is either at or very near the end of its rally. There is a potential Head & Shoulders formation that, if triggered, may erase up to 3 years of gains. Stay tuned.
Earlier this week we reported that, according to Nomura's calculations, CTAs were about to cover their recent S&P short positions and turn increasingly longer the higher the market rose. And sure enough, the US stock market has only risen higher, with the latest two upside catalysts being the positive WSJ headline related to US-China trade talks on Thursday and today's Bloomberg report that China would seek to reduce its trade surplus with the US.
As a result, Nomura’s Masanari Takada writes, the bank's quant models suggest CTAs continued short-covering on major stock index futures like the S&P500 or Russell 2000 and adds, somewhat redundantly, that "US equity markets seem to have enjoyed such mechanical purchasing pressure by algo investors." (ZeroHedge)
High Yield Bond Index Closes Above Intermediate-Term Resistance
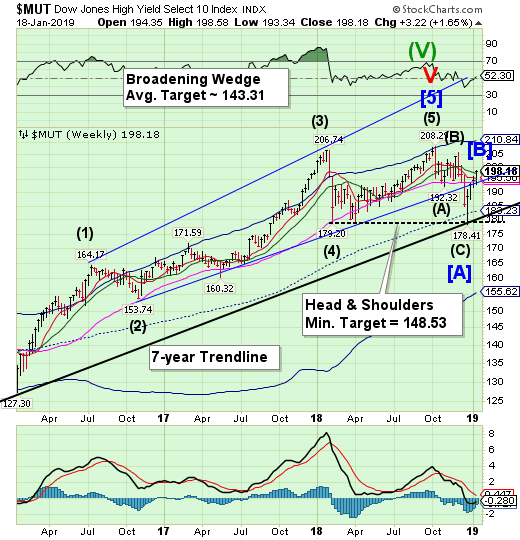
The High Yield Bond Index rallied above Intermediate-term resistance at 197.44, making a 67% retracement of the decline. The rally made more than three weeks of gains, a normal time for a retracement of this degree. The 7-year Trendline is due for a retest in the near future and with that, a potential Head & Shoulders formation that may wipe out up to two years of gains.
Corporate-bond funds saw inflows this week in another sign credit markets are improving following a selloff in December.
U.S. high-yield funds saw an inflow of $3.28 billion in the week ended Jan. 16, the biggest net increase since December 2016, Lipper data show. This followed an inflow of $1.05 billion last week. (Bloomberg)
Treasury Bonds Fall Back Beneath The Mid-Cycle Resistance
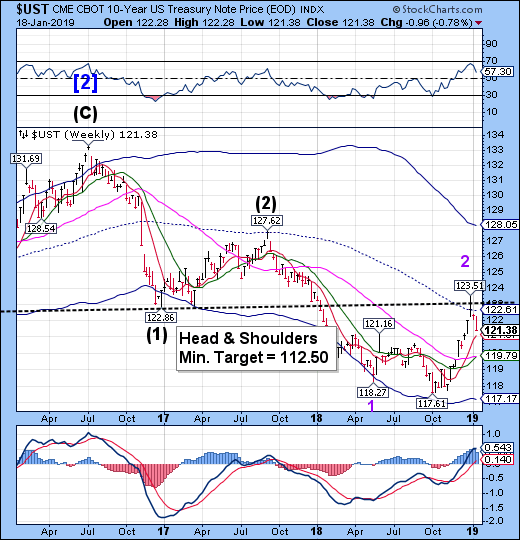
The 10-year Treasury Note Index declined toward short-term support at 121.07, where it may bounce. Note that UST is on a sell signal. Due care is advised, since a decline through Short-term support may instigate a strengthening of intensity in the decline.
U.S. Treasury yields rose tothree-week highs on Friday as investors piled back into WallStreet on hopes Washington and Beijing are moving to end theirtrade dispute and stronger-than-expected data on manufacturingoutput.
Bond yields were on track for a second week of increases as10-year yields climbed further from the near one-year low settwo weeks ago.
"The risk-on mood has caused yields to move higher," saidJohn Canavan, market strategist at Stone & McCarthy ResearchAssociates in New York. (Reuters)
The Euro Confirms A Fake-Out Move
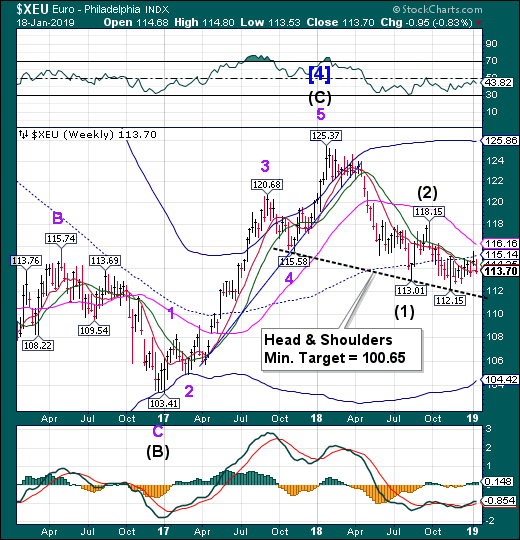
The euro broke down beneath short-term support at 113.86, putting it on a sell signal. The challenge of the mid-Cycle resistance was a fake-out. There is a potential Head & Shoulders formation beneath 112.00 that suggests a downside target that may be attained in the next month.
Twenty years ago, 11 members of the European Union took the historic first step of merging their national currencies into a common unit, the euro. Today, 19 EU members constitute the eurozone, and the euro appears well-established, with further candidates waiting to join.
Birthdays are moments for celebration and reflection. There is much to celebrate about the euro, but honest reflection also reveals its flaws.
The euro’s economic record is mixed, though largely positive. But the euro was always more than an economic project; it played an important political role as a tool to create a truly integrated European Union.
On that score it has been far less successful, and the euro’s political weakness threatens its future and that of the EU. (TheHill)
EuroStoxx Approaches Key Resistance
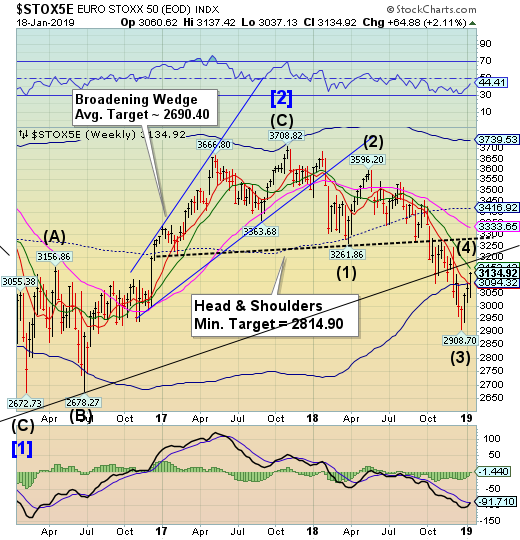
The EuroSTOXX rally gathered strength as it approaches key Intermediate-term resistance at 3153.12 and the trendline just above it. The Cycles Model suggests Cyclical strength may peak this weekend, with the weakness to follow through the middle of February.
European stocks closed higher on Friday after a report of progress on U.S.-China trade talks raised hopes of a breakthrough in their long-running dispute.
The pan-European Stoxx 600 was up more than 1.7 percent following afternoon deals, hitting its highest level since December 5. All sectors and major bourses were trading in positive territory.
For the week Europe’s blue-chip stocks gained more than 2.2 percent.
Stocks in the baskets of Autos and Basic Resources — with their heavy exposure to China — were among the top gainers.
It comes after the Wall Street Journal reported Thursday that U.S. Treasury Secretary Steven Mnuchin proposed lifting all or some of the tariffs on Chinese imports. The goal is to push forward trade talks and get China’s support for longer-term reform. (CNBC)
The Yen May Find Strong Support Beneath It
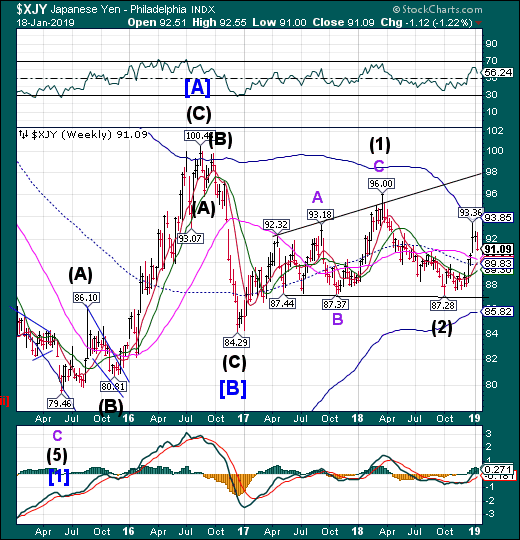
The yen continues its pullback to Long-term support at 90.24, where it may be capable of a bounce. The Cycles Model suggests a continued probe to the upper trendline by the end of the month.
A strengthening link between the dollar-yen exchange rate and the U.S.-Japan yield differential augurs well for the Asian currency, with a number of strategists predicting it will extend its recent rally.
The correlation between the two variables climbed to 0.63 this month, the highest in a year, data compiled by Bloomberg show, as the benchmark 10-year U.S. yield hit a one-year low amid Federal Reserve Chair Jerome Powell’s signal to pause policy tightening. Standard Chartered (LON:STAN) Plc, Citigroup Inc (NYSE:C)., Bank of America Merrill Lynch (NYSE:BAC) and HSBC Holdings Plc (LON:HSBA) are all expecting a stronger yen in the months ahead. (Bloomberg)
Nikkei Approaches Resistance
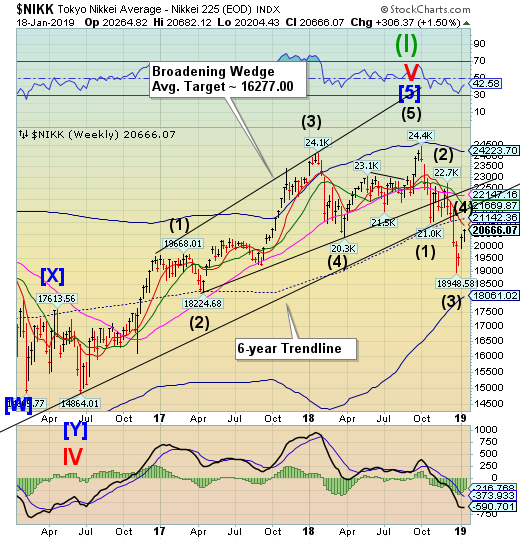
The Nikkei is approaching Short-term resistance at 20868.87. The Cycles Model turns negative early next week, remaining so through the first week of February.The bouncemay be running out of time.
The Nikkei average staged a strong rally on the Tokyo Stock Exchange Friday, boosted by the yen’s drop against the dollar and higher U.S. stock prices.
The 225-issue Nikkei average jumped 263.80 points, or 1.29 percent, to end at 20,666.07, the best finish since Dec. 19. On Thursday, the key market gauge fell 40.48 points.
The Topix index of all first-section issues closed up 14.39 points, or 0.93 percent, at 1,557.59, after gaining 5.43 points the previous day.
Stocks spurted from the outset on purchases activated by the dollar’s rise above ¥109, market sources said. (JapanTimes)
U.S. Dollar Challenge Intermediate-Term Resitance
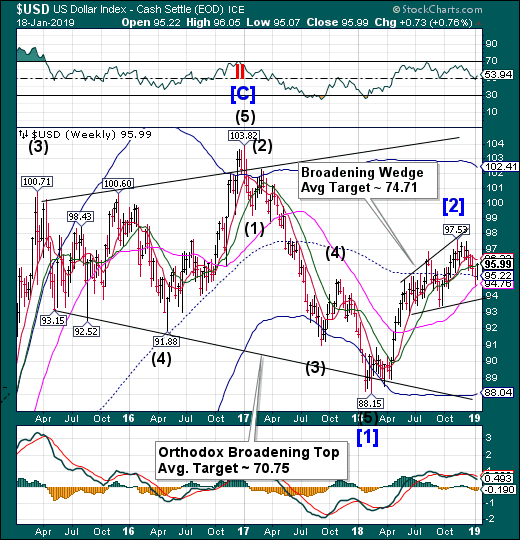
USD rallied to challenge Intermediate-term resistance at 96.05. The USD remains on a sell signal. The Cycles Model suggests weakness for the next 3-4 weeks.
The greenback picked up steam on Friday despite U.S. consumer optimism hitting its lowest level since Donald Trump was elected president and the government shutdown moving into its 28th day.
The dollar was supported by a stronger-than-expected report for U.S. industrial production in December, in which manufacturing posted an impressive 1.1% gain from November. Such positive surprises relieve some of the worries about the strength of the economy after the slowdown at the end of last year. They also underline the relative strength of the U.S. compared to the Euro zone, where the Bank of Italy warned Friday that the country may have slid into recession with a second straight decline in GDP in the fourth quarter of last year. (Investing.com)
Gold Eases To The Bottom Of Its Trading Range
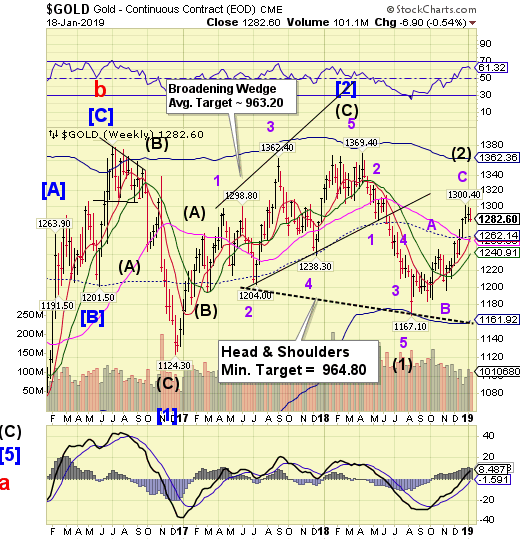
Gold eased to the lower end of its trading range, leaving another “inside” week. The right shoulder of a potential Head & Shoulders formation is complete and the reversal may have begun. The Head & Shoulders formation matches targets with the already existent Broadening Wedge formation.
Gold futures prices dropped Friday to log their first weekly loss since mid-December, as investors pushed into riskier assets, including stocks, fueled by hope of potential progress toward a resolution in the U.S.-China trade dispute.
“The gold price is moving lower today as [risk-on] investors are optimistic about the U.S.-China trade deal despite the fact the Treasury has denied all the recent rumors. But the fact is that Washington and Beijing want to make the deal now and it appears that they have understood the consequences of this turmoil,” said Naeem Aslam, chief market analyst with Think Markets.(MarketWatch)
Crude Finishes A Flat Correction
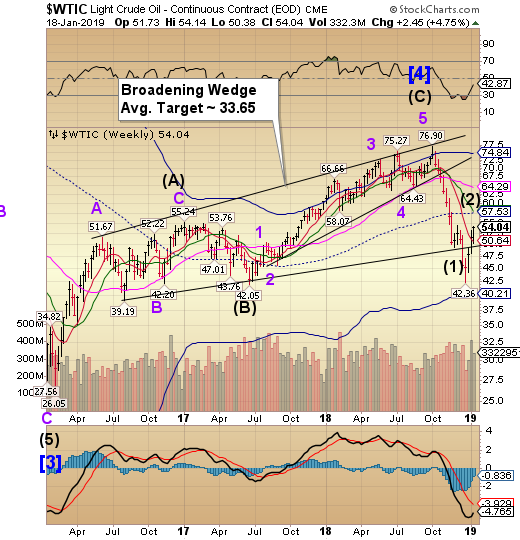
Crude oil is approaching the top of the December corrective bounce, where it may find resistance. While the Cycles were neutral last week, options expiration put a positive twist on the rally. The decline may resume as early as next week through early February.
Oil prices hit a roughly two-month high on Friday, rising with the stock market, on news that China has put forward a plan to eliminate its trade surplus with the United States.
West Texas Intermediate crude futures ended Friday’s session up $1.73, or 3.3 percent, at $53.80 per barrel, the best closing price since Nov 21.
International Brent crude oil futures were up $1.50, or 2.5 percent, at $62.68 per barrel around 2:30 p.m. ET. Brent earlier rose as high as $63, its best intraday price since Dec. 7. (CNBC)
Which stock should you buy in your very next trade?
AI computing powers are changing the stock market. Investing.com's ProPicks AI includes 6 winning stock portfolios chosen by our advanced AI. In 2024 alone, ProPicks AI identified 2 stocks that surged over 150%, 4 additional stocks that leaped over 30%, and 3 more that climbed over 25%. Which stock will be the next to soar?
Unlock ProPicks AI
