Technical Analsys
Technical Analysis & WHEAT/RUB: 2019-05-15
Sowing wheat in the US is behind schedule
In this review we suggest to consider the WHEAT/RUB Personal Composite Instrument(PCI). It reflects the price dynamics of wheat versus Russian ruble. Is the growth of WHEAT/RUB quotations possible?
It rises when wheat becomes more expensive on the world market and the Russian currency weakens. The fall of the ruble exchange rate may cause an increase in purchases of foreign currency by the Ministry of Finance of the Russian Federation. In accordance with the “fiscal rule”, the Ministry of Finance of Russian acquires currency for budget revenues from the sale price of Russian oil over $40 per barrel. From May 14, 2019 to June 6, ministry will purchase US dollars amounted 16.7 billion rubles ($ 256 million) per day. This is noticeably more than the volume in the previous period, which amounted to 11.6 billion rubles per day. An additional negative factor for the ruble may be the Russian Central Bank's plans to lower the key rate. It is equal to 7.75% with inflation of 5.2%. In turn, wheat has risen in price due to a report that the sowing company is lagging behind the schedule in the Midwestern United States. Russia is going to reduce wheat exports in the agricultural season 2019/20 to 36 million tons, compared with 37 million tons in the 2018/19 season. The Food and Agriculture Organization of the United Nations (FAO) expects a reduction in the grain harvest in Ukraine by 5.6% to 65.3 million tons in 2019.
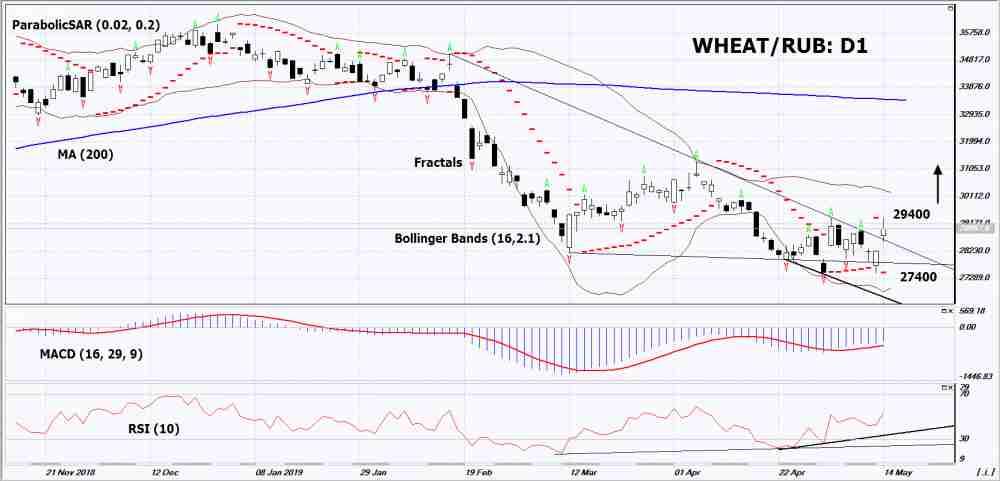
On the daily timeframe, WHEAT/RUB: D1 exceeded the resistance line of the downward trend. Various technical analysis indicators generated uptrend signal. Further growth of quotations is possible in case of an increase in demand and a reduction in world yield.
-
The Parabolic indicator demonstrates the signal to increase.
-
The Bollinger® bands widened, indicating high volatility. The bottom line of Bollinger has a slope up.
-
The RSI indicator is above the 50 mark. It formed a double divergence to the rise.
-
The MACD indicator indicates a signal to increase.
The bullish momentum may develop if WHEAT/RUB exceeds the last two upper fractals and the Parabolic signal: 29400. This level may serve as an entry point.The initial stop loss may be placed below the last lower fractal and the 11-month minimum: 27400. After opening the pending order, we shall move the stop to the next fractal low following the Bollinger and Parabolic signals to the next fractal minimum. Thus, we are changing the potential profit/loss to the breakeven point. More risk-averse traders may switch to the 4-hour chart after the trade and place there a stop loss moving it in the direction of the trade. If the price meets the stop level (371) without reaching the order (390), we recommend to close the position: the market sustains internal changes that were not taken into account.
Summary of technical analysis
Position Buy
- Buy stop Above 29400
- Stop loss Below 27400
Market Overview
President Trump’s comments buoy markets
Dollar gains on import prices rise
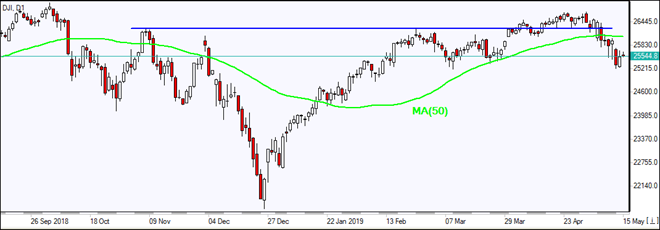
US stock market rebounded on Tuesday after President Trump said he had not decided whether to impose tariffs on an additional $300 billion of Chinese goods, and it should be clear in “three or four weeks” if the last trip of US delegation to China to discuss the trade deal was successful. The S&P 500 gained 0.8% to 2834.41. Dow Jones Industrial Average added 0.8% to 25532.05. The Nasdaq rose 1.1% to 7734.49. The dollar snapped four-session slide as small business optimism rose to a four-month high in April while US import prices rose below expected 0.2% in April. The live dollar index data show the ICE (NYSE:ICE) US Dollar index, a measure of the dollar’s strength against a basket of six rival currencies, rose 0.2% to 97.513 but is lower currently. Futures on US stock indexes point to lower openings today.
CAC40 outperforms European indexes
European stocks rebounded on Tuesday as market sentiment was buoyed by late Monday comments by President Trump. Both the EUR/USD and GBP/USD continued their slide and are lower currently. The Stoxx Europe 600 ended 0.9% higher led by technology shares. The German DAX 30 added 1.0% to 11991.62, France’s CAC 40 jumped 1.5%. UK’s FTSE 100 rose 1.1% to 7241.60.
Shanghai Composite leads Asian Indexes rebound
Asian stock indices recovered most of their previous session losses today. Nikkei gained 0.6% to 21188.56 as yen decline against the dollar continued. Chinese stocks turned higher after President Trump comment calling the tariff war a “little squabble” while the US started the legal process of imposing 25% tariffs on another $325 billion of Chinese goods: the Shanghai Composite Index is up 1.9% and Hong Kong’s Hang Seng index is 0.4% higher. Australia’s All Ordinaries Index turned 0.7% higher as Australian dollar accelerated its decline against the greenback.
Brent rising on Middle East tensions
Brent futures prices are edging higher today. Prices rose yesterday as Saudi Arabia reported drones attacked its oil pipeline and energy infrastructure. The American Petroleum Institute late Tuesday report indicated US crude inventories rose by 8.6 million barrels last week while gasoline inventories grew by 0.567 million. Prices ended higher yesterday. July Brent rose 1.4% to $71.24 a barrel on Tuesday. Today at 16:30 CET the Energy Information Administration will release US Crude Oil Inventories.


