When I woke up yesterday morning, I saw that stock index futures were deeply in the red. The headline explanation was that Chinese authorities had taken steps to cool off stock market speculation. Later, I saw that there were jitters over a the unexpected Greek Presidential election call.
Whatever the cause for the weakness, US stock indices gapped down at the open, but started to recover at around noon after the European close. By the end of the day, the SPX managed to recover all of its losses and close the day flat and the NASDAQ Composite and the small cap Russell 2000 were actually positive on the day.
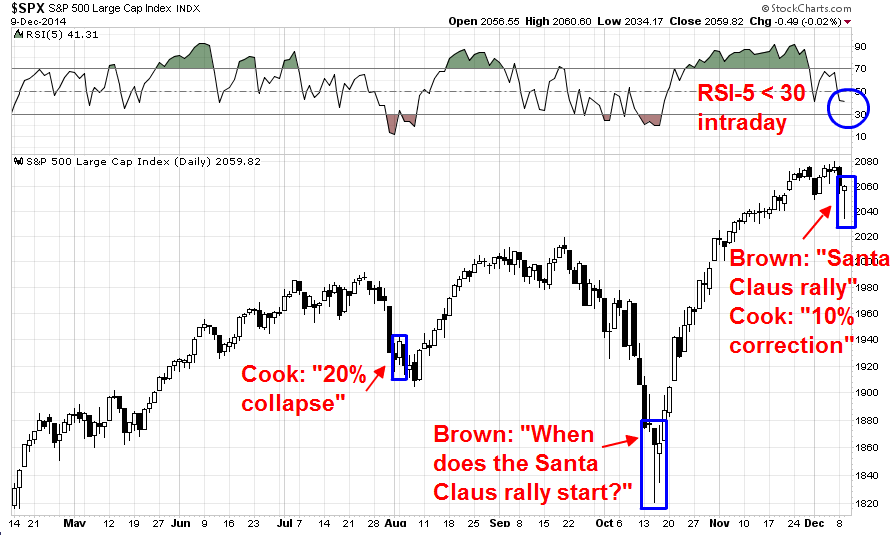
As the chart below of the SPX shows, the market displayed a classic reversal bottom pattern. There were also a number of quirky signs that yesterday marked a bottom for any temporary stock market weakness. First and foremost, the 5-day RSI (top panel) moved from an overbought reading of over 70 on November 28 to under 30 on an intra-day basis, which indicates an oversold reading. Such conditions are often indicative of either short-term bottoms or minimal market downside.

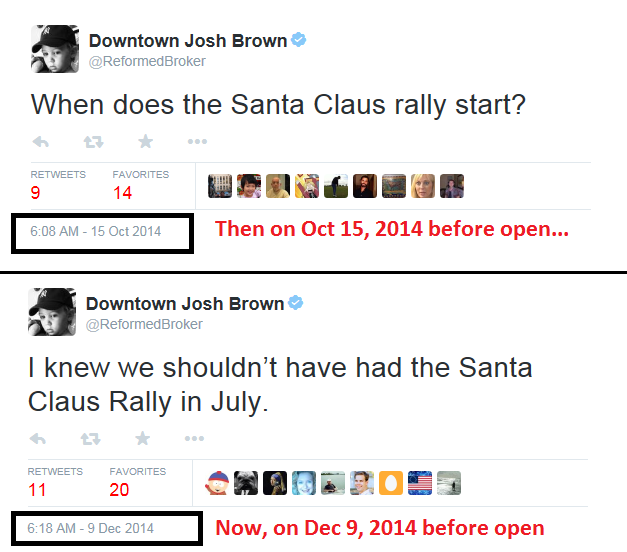
The Josh Brown "Santa Claus" indicator
I have also noticed that Josh Brown has a habit of making irreverent remarks at market extremes. He tweeted a flippant comment about a Santa Claus rally on October 15, 2014, the day of the October bottom and market reversal. Yesterday, he tweeted a similar remark:

The Marketwatch "Mark Cook" indicator
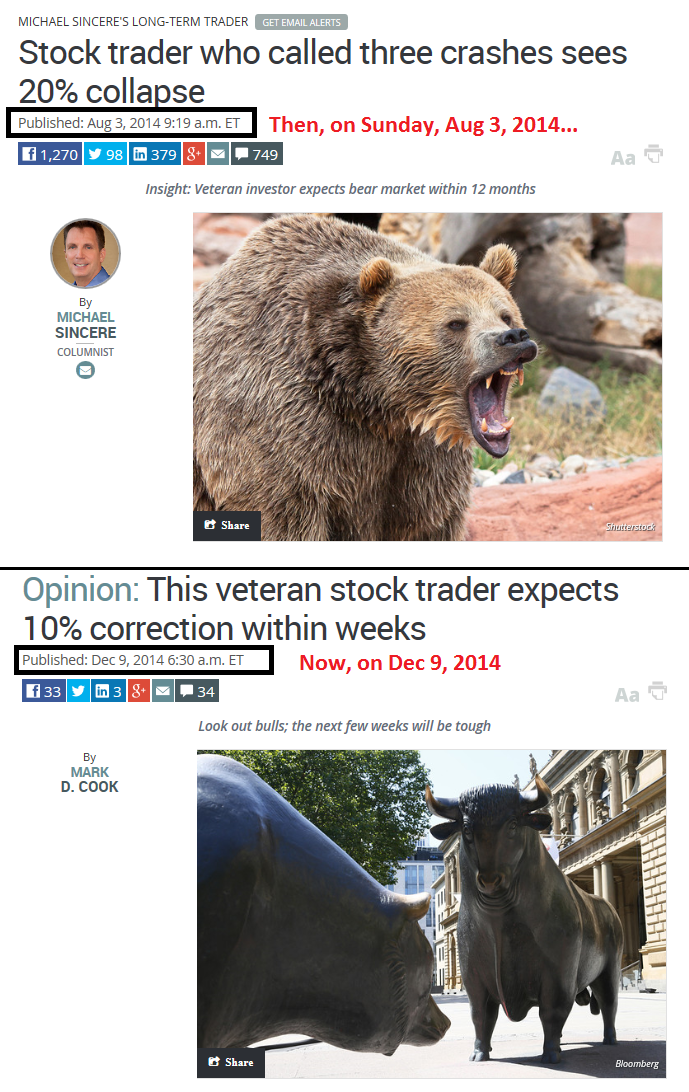
Coincidentally, Marketwatch featured a column by Mark Cook warning about a 10% correction yesterday:
The key short-term stock market indicator that I have used for many years is exceptionally rare, but once triggered is deadly for the bulls. The last time it triggered, the S&P 500 SPX, -0.02% shed 180 points — and the configuration now is almost identical to then.
Accordingly, I expect a 10% decline in the S+P 500 before Jan 30 if the S&P 500 dips below 2049 this week.
On Sunday, August 3, 2014, Marketwatch also had an article by Mark Cook warning about a 20% decline in stock prices. Cook based his conclusion on his proprietary Tick indicator:
“The Tick readings I am seeing (-1100 and -1200) is like an accelerator on the floor that is pressed for an indefinite amount of time,” Cook says. “Eventually the motor will run out of gas. Now, anything that comes out of left field will create a strain on the market.” Since the CCT is a leading indicator, prices have to catch up with the negative Tick readings.
“Think of a dam that has small cracks that are imperceptible to the eye,” he says. “Finally, the dam gives way. Eventually, prices will go south, and the Tick numbers will be horrific.”
To be fair to Cook, he did warn that the market may not go down right away and there could be significant lags from this signal:
Unfortunately, Cook can’t say when this vulnerable market will crack. “The CCT is similar to the new-high, new-low indicator,” he explains. “As the market goes higher, fewer stocks make new highs. Some people might say it’s ‘different this time,’ but it’s never is. Could the market go higher? Yes, it could, but the extension of time will create an even greater divergence that has to be snapped back together.”

How did the 20% decline forecast work out? The stock market fell slightly after the publication of that warning in August but bottomed out that week (see SPX chart above).
While this is not meant to be an indictment of Mark Cook and his technical analysis abilities, it is more of an indictment of Marketwatch editors, who chose to feature bearish headlines just as the selling frenzy hit its peak.
Sometimes it can be rewarding to monitor these quirky market indicators as measures of sentiment. Based on my assessment of the market technicals today, I would venture a guess that the near-term downside for stock prices is limited.
Disclosure: Cam Hui is a portfolio manager at Qwest Investment Fund Management Ltd. ("Qwest"). This article is prepared by Mr. Hui as an outside business activity. As such, Qwest does not review or approve materials presented herein. The opinions and any recommendations expressed in this blog are those of the author and do not reflect the opinions or recommendations of Qwest.
None of the information or opinions expressed in this blog constitutes a solicitation for the purchase or sale of any security or other instrument. Nothing in this article constitutes investment advice and any recommendations that may be contained herein have not been based upon a consideration of the investment objectives, financial situation or particular needs of any specific recipient. Any purchase or sale activity in any securities or other instrument should be based upon your own analysis and conclusions. Past performance is not indicative of future results. Either Qwest or Mr. Hui may hold or control long or short positions in the securities or instruments mentioned.
Which stock should you buy in your very next trade?
With valuations skyrocketing in 2024, many investors are uneasy putting more money into stocks. Unsure where to invest next? Get access to our proven portfolios and discover high-potential opportunities.
In 2024 alone, ProPicks AI identified 2 stocks that surged over 150%, 4 additional stocks that leaped over 30%, and 3 more that climbed over 25%. That's an impressive track record.
With portfolios tailored for Dow stocks, S&P stocks, Tech stocks, and Mid Cap stocks, you can explore various wealth-building strategies.
