The economic calendar had most of the big news last week. Earnings season is winding down. It is a time to digest and analyze what we have learned. Many will be asking:
Why is employment growth still strong while other indicators show weakness?
Prior Theme Recap
In my last WTWA (two weeks ago), I predicted that the media buzz would focus on the challenge to the old highs in the stock market. This was indeed a popular topic as the market moved higher. After last Tuesday’s primaries, it was trumped by political news. (I have trumping on my mind (heh heh) only because many of my friends are currently competing in the Team Trials to determine the U.S. representative to the 2016 World Bridge Games).
The attempt at a new S&P 500 stock record missed again and the early strength last week also faded. Doug Short captures the story with his excellent weekly chart. (With the ever-increasing effects from foreign markets, you should also add Doug’s World Markets Weekend Update to your reading list).
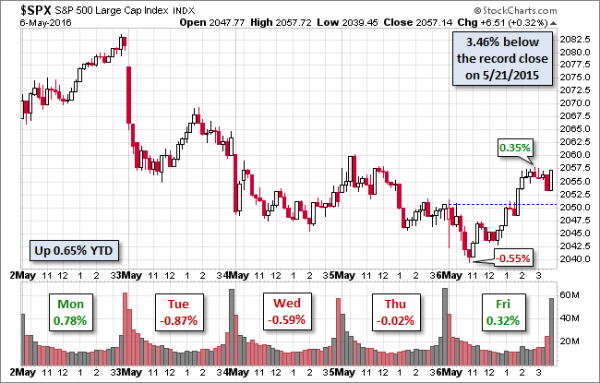
The entire post adds more analysis on the major themes as well as a multi-year context. Since it has been two weeks since the last WTWA, I will include a second of Doug’s charts to catch up. You can see another failed rally, a triple top, a head-and-shoulders, and an upside down head-and-shoulders.
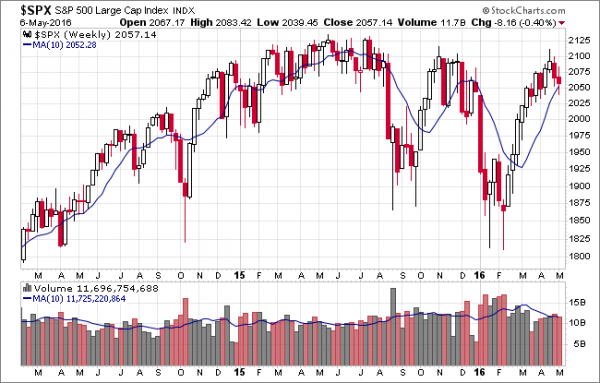
We would all like to know the direction of the market in advance. Good luck with that! Second best is planning what to look for and how to react. That is the purpose of considering possible themes for the week ahead. You can make your own predictions in the comments.
This Week’s Theme
The economic calendar has mostly secondary reports this week. Friday’s employment data rekindled an ongoing debate about employment growth versus the other indicators showing economic weakness. We will have help (?) from plenty of FedSpeak, probably offering widely different conclusions. I expect attention to center on the following question:
Why is employment fairly strong while so many other indicators seem weak?
The Sideshow
My suggested theme is a bit too wonky for media sources seeking viewers and readers. I understand that many will be tempted instead to wax political, trying to infer what the election means for your investments. I wrote about the political theme two months ago, and the implications have not really changed. Just skip to the conclusion of that post. This week Barry Ritholtz does one of the better pieces on political implications for investors, reaching a conclusion similar to mine. He notes the biggest new idea, also debated by the Squawk on the Street gang: A Trump presidency might well involve refinancing debt and doing a lot of construction.
Here are some public policy differences between the leading candidates. It is a starting point for thinking about specific stocks.
Background
Pundit scrambling continues. After last Monday’s modest market strength, a TV anchor glibly stated that the gains were not surprising given the start of the month and the expected news from BuffettFest. He had not suggested this on Friday, in time for your trading and the tune quickly changed on Tuesday. So typical.
Those charged with explaining each and every piece of economic news have had to deal with a mixed picture.
Question
How much time per day does the average Facebook (NASDAQ:FB) user spend on the site? Answer at the end of today’s post.
Viewpoints
The basic themes, moving from bearish to bullish on stocks are as follows:
- Global recession is upon us. There is something wrong with employment data. GDP is better.
- Most recent U.S. indicators have missed expectations.
- Leading indicators show a slower rate of expansion. Employment will soon catch up.
- Earnings have been engineered. Just look at sales for the truth.
- Job growth is the most reliable economic indicator, better than GDP. (NYT)
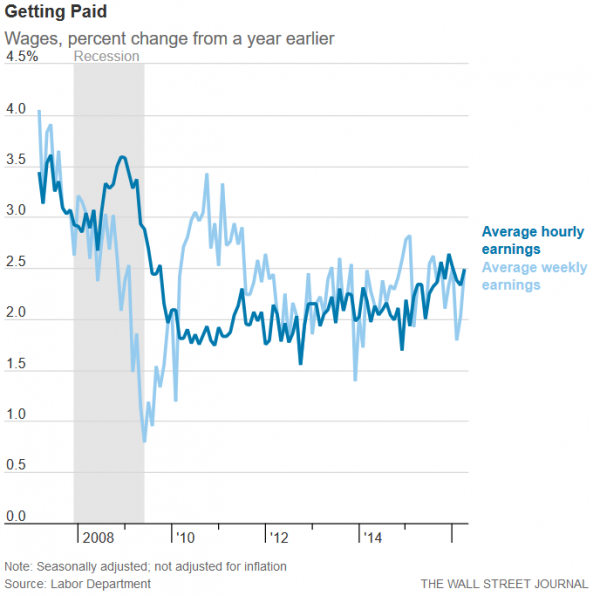
- Wages show a consistent 2.5% year-over-year increase. Spending will follow.
- Q1 will mark (yet another) soft spot to the start of the year. Expect a resumption of modest growth.
- Growth is about to increase, stimulated by increased Federal deficits, policy changes in China, and low interest rates.
It is easy to find disciples for each viewpoint. As always, I have my own opinion in the conclusion. Make your own choice, and feel free to make your case in the comments.
But first, let us do our regular update of the last week’s news and data. Readers, especially those new to this series, will benefit from reading the background information.
Last Week’s Data
Each week I break down events into good and bad. Often there is an “ugly” and on rare occasion something really good. My working definition of “good” has two components:
- The news is market-friendly. Our personal policy preferences are not relevant for this test. And especially – no politics.
- It is better than expectations.
The Good
There was some good news.
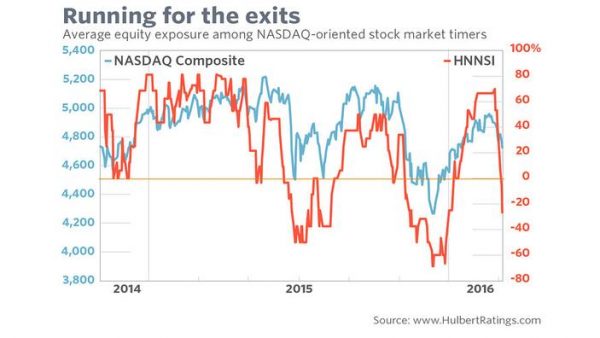
- Bullishness registers a major drop. Mark Hulbert explains why the market timer behavior is probably bullish for stocks.
- ISM services increased and beat expectations. The reading of 55.7 also reflected some positive comments from respondents.
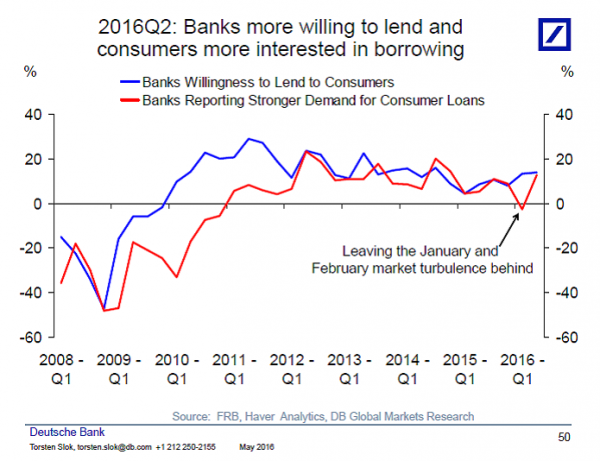
- The lending environment has improved. Torsten Sløk of Deutsche Bank (via Barry Ritholtz) writes that banks are more willing to lend and consumers more willing to borrow. Using the Fed’s Senior Loan Officer Survey, he cites stronger consumer balance sheets and solid improvement growth as reasons for improvement from a sluggish start to the year.
- Earnings reports were mixed. FactSet reports that the earnings beat rate is positive. The sales beat rate remains below the five-year average. A common story is a company beating on the bottom line, but missing on sales, also slightly worse than the five-year average. Outlooks are better than average. Utilities are weak. Auto companies are strong. Brian Gilmartin is a bit more optimistic (but cautious) as he cites the ex-energy numbers.
- Employment growth remains positive. The monthly employment report is sufficiently complicated to permit spinning in any direction. I heard authoritative sources comment on the net jobs increase needed to avoid more unemployment, with a range from 85,000 to 130,000. My employment preview post explained why too much is made over small changes in a single month. The basic trend of reasonable growth continues, but without the major increase we normally see in an expansion. This economic recovery has been slower and stretched out. The question is how much further employment can improve. While everyone has an opinion, the WSJ always had a good chart pack on this subject. Here is one:
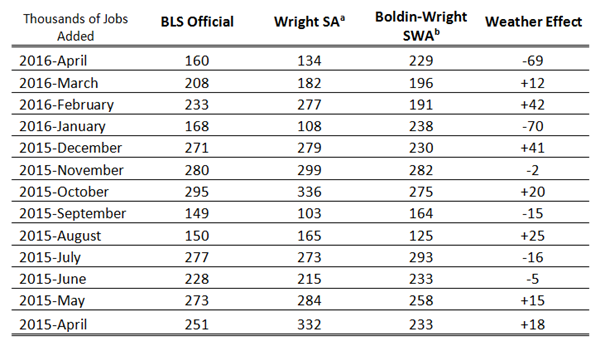
A source with no horse in the race (Holmes instructed me not to use “dog in the hunt”) has an interesting take on seasonal adjustments. He believes that the adjustment background is too short and the weather recognition too limited. This is a good subject for a full post, but readers may want to consider it.
The Bad
Some of the news was negative.
- Productivity increased and beat expectations. But it remains unacceptably low. Scott Grannis calls it the “missing ingredient.”
- ISM manufacturing dropped to 50.8 and slightly missed expectations.
- Auto sales missed expectations by about 0.5%, but improved over the prior month.
The Ugly
Cheating on data announcements. A study by the ECB suggests the presence of “informed trading.” (This sounds like one of my euphemisms!) The results cover a wide range or reports including both public and private. This is an important topic for traders, especially those carrying positions overnight. Here is a key quote:
Abstract
We examine stock index and Treasury futures markets around releases of U.S. macroeconomic announcements. Seven out of 21 market-moving announcements
show evidence of substantial informed trading before the official release time. Prices begin to move in the “correct” direction about 30 minutes before the release time.
The pre-announcement price drift accounts on average for about half of the total price adjustment. These results imply that some traders have private information about macroeconomic fundamentals. The evidence suggests that the pre-announcement drift likely comes from a combination of information leakage and superior forecasting based on proprietary data collection and reprocessing of public information.
If you believe that the results are achieved from “superior forecasting” you are not a long-time reader of WTWA!
The Silver Bullet
I occasionally give the Silver Bullet award to someone who takes up an unpopular or thankless cause, doing the real work to demonstrate the facts. Think of The Lone Ranger. This week’s award goes to Jeff Reeves who questions a Reuters column suggesting that Tesla (NASDAQ:TSLA) was overvalued since its market cap represented a huge multiple of cars sold.
$620,000 for every car it delivered last year, or $63,000 for every car it hopes to produce in 2020.
By comparison, General Motors (NYSE:GM) Co’s $48 billion market value is equivalent to about $4,800 for every vehicle it sold last year.
Reeves suggests (after the mandatory “with all due respect”) that you are an idiot if you take that approach. He provides a number of excellent examples from other companies illustrating that this is a completely irrelevant approach to valuation. Please read the article to see how Netflix (NASDAQ:NFLX), Facebook, Apple (NASDAQ:AAPL), Coke (NYSE:KO), the New York Times (NYSE:NYT), and biotech might compare.
There are so many catchy headlines and so little refutation!
Quant Corner
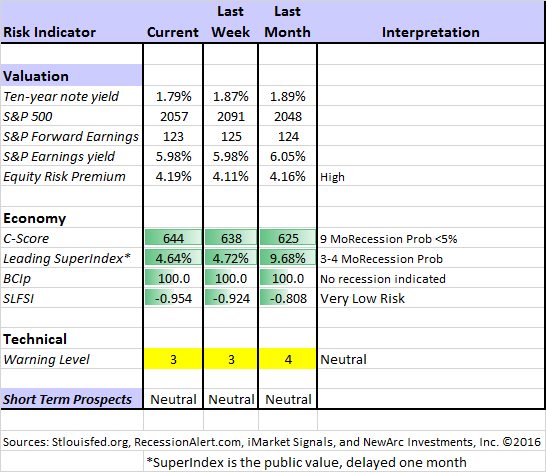
Whether a trader or an investor, you need to understand risk. I monitor many quantitative reports and highlight the best methods in this weekly update. I recently made some changes in our regular table, separating three different ways of considering risk. For valuation I report the equity risk premium. This is the difference between what we expect stocks to earn in the next twelve months and the return from the ten-year Treasury note. I have found this approach to be an effective method for measuring market perception of stock risk. This is now easier to monitor because of the excellent work of Brian Gilmartin, whose analysis of the Thomson-Reuters data is our principal source for forward earnings.
Our economic risk indicators have not changed.
In our monitoring of market technical risk, I am now using our new model, “Holmes”. Holmes is a friendly watchdog in the same tradition as Oscar and Felix, but with a stronger emphasis on asset protection. We have found that the overall market indication is very helpful for those investing or trading individual stocks. The score ranges from 1 to 5, with 5 representing a high warning level. The 2-4 range is acceptable for stock trading, with various levels of caution.
The new approach improves trading results by taking some profits during good times and getting out of the market when technical risk is high. This is not market timing as we normally think of it. It is not an effort to pick tops and bottoms and it does not go short.
Interested readers can get the program description as part of our new package of free reports, including information on risk control and value investing. (Send requests to info at newarc dot com).
In my continuing effort to provide an effective investor summary of the most important economic data I have added Georg Vrba’s Business Cycle Index, which we have frequently cited in this space. In contrast to the ECRI “black box” approach, Georg provides a full description of the model and the components.
For more information on each source, check here.
Recent Expert Commentary on Recession Odds and Market Trends
Doug Short: Provides an array of important economic updates including the best charts around. One of these is monitoring the ECRI’s business cycle analysis, as his associate Jill Mislinski does in this week’s update. She cites a recent presentation by ECRI co-founder Lakshman Acuthan suggests a period of “stagflation lite.” The review of the ECRI is comprehensive and provides an interesting comparison with Recession Alert, one of our featured sources. Chart lovers will love this regularly updated article.
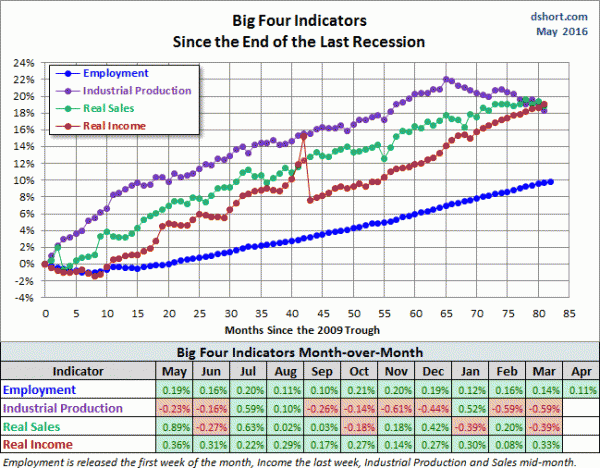
Doug’s Big Four update is the single best visual review of the indicators used in official recession dating. You can see each element and the aggregate, along with a table of the data. Doug’s updates cover both the individual elements and a chart-packed summary helping to see what it all means. Here is the look after Friday’s employment report.
Bob Dieli does a monthly update (subscription required) after the employment report and also a monthly overview analysis. He follows many concurrent indicators to supplement our featured “C Score.” His view of where we are in the business cycle differs sharply from that of the ECRI. His approach has been more accurate over a long period and especially in the last decade. I am overdue for an update comparing the recession methods. (So many great topics to consider, so little time).
RecessionAlert: A variety of strong quantitative indicators for both economic and market analysis. While we feature the recession analysis, Dwaine also has a number of interesting systems. These include approaches helpful in both economic and market timing. He has been very accurate in helping people to stay on the right side of the market.
Georg Vrba: provides an array of interesting systems. Check out his site for the full story. We especially like his Business Cycle Indicator, updated weekly and now featured in our table. Georg also has an unemployment rate recession indicator. This has long confirmed that there is no recession signal. What would it take to change the prognosis? In this interesting post he suggests that an increase of 0.3% in unemployment would warn of a recession.
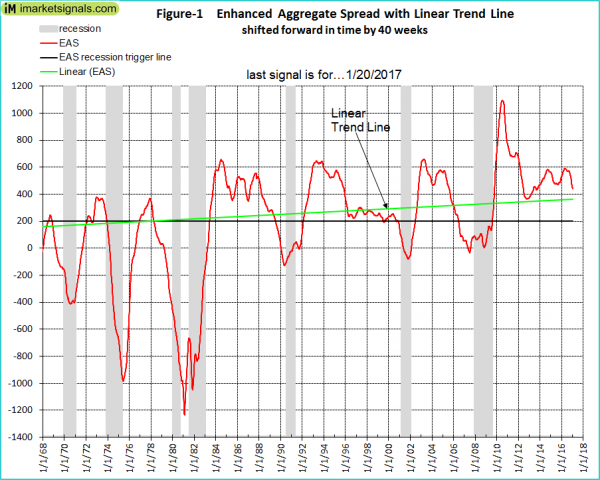
This week Georg added a new indicator, (DAGS) a variant of Bob Dieli’s Enhanced Aggregate Spread. His excellent article includes a discussion of what might cause a recession as well as an approach that historically would have improved the lead time for a recession signal. In a companion post he describes the Dieli method including similar charts for comparison. Concerning the prospects for a recession, Georg writes as follows:
Assuming that the current trajectory of the DAGS does not change, then it will reach zero in the fourth quarter of 2016, signaling the possibility of a recession start 40 weeks later, in the third quarter of 2017. However the DAGS could rise again, as it did after January 2012 when it was at a similar level to where it is now.
Under current economic conditions the DAGS would indicate a cycle peak much earlier than the EAS, and when such a signal occurs there would be ample time to consult a set of coincident indicators to make a recession call.
The Week Ahead
We have a modest week for economic data. While I highlight the most important items, you can get an excellent comprehensive listing at Investing.com. You can filter for country, type of report, and other factors.
The “A List” includes the following:
- Retail sales (F). Expectations are for a solid rebound.
- Michigan sentiment (F). Some distrust survey data, but there is no better way to discover current spending and employment trends.
- JOLTS Report (T). The report on job openings is still relatively new and widely misunderstood. Important indicator of structural changes in the job market.
- Initial claims (Th). The best concurrent indicator for employment trends.
The “B List” includes the following:
- Wholesale inventories (T). Volatile March data, relevant for Q1 GDP.
- Business inventories (F). March data, but relevant for Q1 GDP.
- PPI (F). Inflation by any measure remains of secondary importance until we get a few hot months. Then the story will change significantly.
- Crude inventories (W). Often has a significant impact on oil markets, a focal point for traders of everything.
FedSpeak is back! Those thirsting to hear more from Fed Regional Presidents will have an opportunity almost every day next week. Political news will continue, but a big market impact is unlikely – at least for now.
There are still some important earnings reports as the Q1 reporting season winds down.
How to Use the Weekly Data Updates
In the WTWA series I try to share what I am thinking as I prepare for the coming week. I write each post as if I were speaking directly to one of my clients. Each client is different, so I have six different programs ranging from very conservative bond ladders to very aggressive trading programs. It is not a “one size fits all” approach.
To get the maximum benefit from my updates you need to have a self-assessment of your objectives. Are you most interested in preserving wealth? Or like most of us, do you still need to create wealth? How much risk is right for your temperament and circumstances?
WTWA often suggests a different course of action depending upon your objectives and time frames.
Insight for Traders
We continue our neutral market forecast. Felix is still 100% invested, but there are fewer attractive sectors. The more cautious Holmes remains close to fully invested. Holmes uses a universe of nearly 1000 stocks, selected mostly by liquidity. Even when the overall market is neutral, there will often be some strong candidates. Holmes holds a maximum of 16 positions at one time. For more information about Felix, I have posted a further description — Meet Felix and Oscar. You can sign up for Felix and Oscar’s weekly ratings updates via email to etf at newarc dot com. They appear almost every day at Scutify (follow here). I am trying to figure out a method to share some additional updates from Holmes, our new portfolio watchdog. (You learn more about Holmes by writing to info at newarc dot com.
Dr. Brett continues to find ideas that no one else has discussed. This week he explains about the “path” to a good trade. Here is a stimulating excerpt:
Let’s do a thought experiment: I might expect a stock index to move from 2000 to 2100, a 5% move. Let’s say the index remained nearly unchanged in value for six months before shooting higher to 2100 in the seventh month. How many traders would have stuck with this trade?
Let’s consider a different scenario: The index moves from 2000 to 2100 in one month, but only after having dropped to 1940 in the first week. How many traders would have stuck with this trade?
Mike Bellafiore warns not to jump the gun, anticipating before your setups are really in place.
(The cautious Holmes is barking approval at this idea).
Insight for Investors
I review the themes here each week and refresh when needed. For investors, as we would expect, the key ideas may stay on the list longer than the updates for traders. Major market declines occur after business cycle peaks, sparked by severely declining earnings. Our methods are focused on limiting this risk. Start with our Tips for Individual Investors and follow the links.
We also have a page summarizing many of the current investor fears. If you read something scary, this is a good place to do some fact checking. Pick a topic and give it a try. Feel free to suggest new topics if your own “fear” is not on the list.
Many individual investors will also appreciate our two new free reports on Managing Risk and Value Investing. (Write to info at newarc dot com).
Other Advice
Here is our collection of great investor advice for this week. If I had to pick a single most important source for investors to read, it would be Morgan Housel’s post, Alternative Definitions of Risk. He explains that even significant market volatility (like 2011) does not signal real risk. He cites several types of risk that are often neglected. Here is a good example:
The risk of inadequate return
Cash is now the most desirable asset among savers age 18 to 29, even if the money isn’t needed for 10 years, according to a survey by Bankrate.
Young investors do this to cut down on the risk of investing in stocks. But odds are they will come to see this as one of the riskiest investments they ever make. Cash for the long-term won’t fund future goals, while the market volatility they’re avoiding today posed little risk to those future goals.
Stock Ideas
Goldman Sachs recommends a dividend basket.
When should you sell a stock? George Athanassakos a Professor of Finance and the Ben Graham Chair in Value Investing suggests eight reasons. I like and use them all!
Personal Finance
Professional investors and traders have been making Abnormal Returns a daily stop for over ten years. The average investor should make time (even if not able to read AR every day as I do) for a weekly trip on Wednesday. Tadas always has first-rate links for investors in this special edition. There are several great choices worth reading. We all like apps and we also like saving money, so you will enjoy my favorite from the group, 5 Apps That Will Actually Save You Money.
Outlook
Oppenheimer Funds sees the China prospects as encouraging. This is an interesting contrarian viewpoint.
Value Stocks
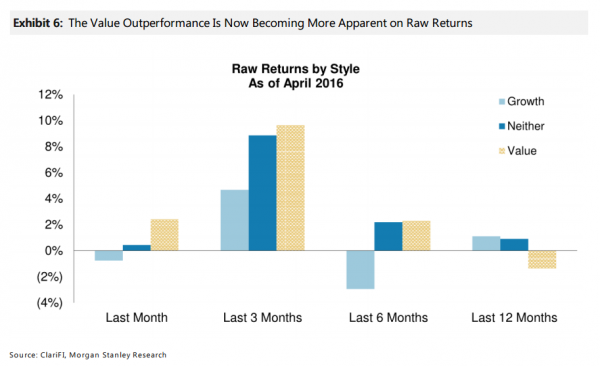
Has the tide turned? Morgan Stanley notes that in 2016 value has beaten growth. So far, so good for my prediction that 2016 will be the year of the value stock. (For those interested, get a free report from main at newarc dot com).
Watch out for….
Non-traded REITs. Before deciding that this is the right investment for you, be sure to read the fine print. Here some excerpts of listed risk factors from an actual offering. As a buyer, you sign off indicating that you have read all of this stuff!
the proceeds from a sale or redemption of shares may be less than the original amount invested;
there are substantial conflicts among the interests of the REIT’s advisor, sponsor, dealer manager and respective affiliates;
may incur substantial debt, which could adversely impact the value of an investment;
obligated to pay substantial fees to its advisor;
may pay distributions from any source, and there are no limits on distributions that may be paid from sources other than cash flow from operations;
…and a general observation that payments may come from assets rather than operations. So much for your expected 7% annual return.
Final Thoughts
When I do not have a solid answer to the weekly theme question, I am not afraid to say so. If only more observers would do the same! Readers sometimes complain that I do not give a specific answer to my own question. That misses the point. The weekly question is my prediction for the market theme – what you will see in the media. I cannot control that, and it would be dishonest to claim an answer that I do not really have.
This week is different. I have confidence in the recession indicators I cite – chosen after extensive study and analysis. I also have studied labor economics and the various tracking measures. Most of those commenting on the employment versus GDP question are talking their book. The bond folks disparage employment and the stock reps cite employment data. My mission is quite different. I need to guide clients into whatever is best for their personal circumstances and the current environment.
While I have looked at many indicators, here are two that are typical of the main theme.
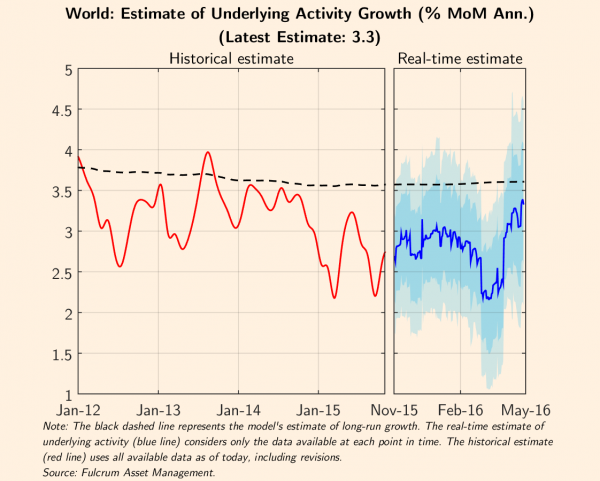
1. The global economic fears are overstated. Gavyn Davies (FT) has a thoughtful article, Fading Risks of Global Recession. He cautiously notes as follows:
The latest nowcast shows a rebound in global activity growth to 3.4 per cent, which is just below trend. Growth in the advanced economies has rebounded from a low point of 1 per cent in February to 1.4 per cent now (ie still about 0.3 per cent below trend). Growth in the emerging economies has jumped from 3 per cent in February to 5.5 per cent now, which is at trend for the first time in three years. However, the rebound in the emerging economies is driven by improvements in China and Brazil, both of which are subject to large risks of renewed setbacks in coming months.
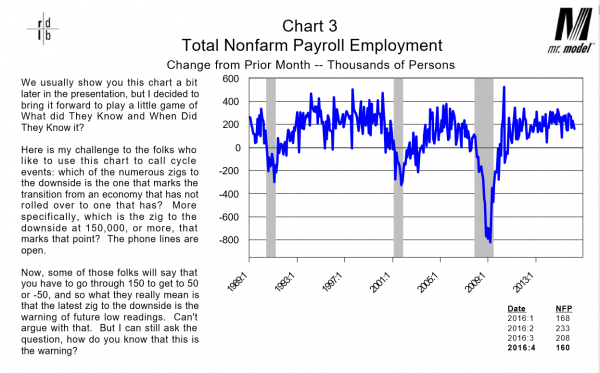
2. Employment, measured in many different ways, shows no sign of rollover. One advantage of subscribing to Bob Dieli’s service is a monthly deep dive into the employment data, published the day of the report. Whether you are interested in labor force participation, part time workers, wages, job quality or overall trends, one of the forty pages of charts will provide an answer. I am trying to persuade Bob to offer a lower-priced version for average investors. His big theme this week was that the economy was not rolling over. The expansion phase continues. The chart below is but one example:
Getting the most out of your investments is not just a matter of buy-and-hold. It also does not require guessing the “normal” market volatility in an effort to be a genius. It certainly does not mean going all-in or all-out.
Long-term investors profit from a focus on data, not emotion.
Answer to the Facebook question: 50 minutes per day. My reaction is Wow! What is yours?

