The economic calendar has more news, including a meeting of the FOMC. Earnings season is in full swing. Despite all of the substantive news, the punditry loves to discuss markets, especially when they are challenging the old highs. Many will be asking:
Will stocks (finally) set a new record high?
Prior Theme Recap
In my last WTWA I predicted that markets might already have anticipated the Doha oil conference as well as the trend of first-quarter earnings reports. Despite the lack of an agreement from the meeting, energy stocks and the overall market moved higher.
Earnings reports also tilted negative, but with only modest effect. With no obvious way to explain the market action, many observers did opine that the events were already anticipated. What would have been the predictions for the week had people known about Doha and earnings in advance?
Doug Short captures the deceptively quiet S&P 500 week with his excellent weekly chart. (With the ever-increasing effects from foreign markets, you should also add Doug’s World Markets Weekend Update to your reading list).
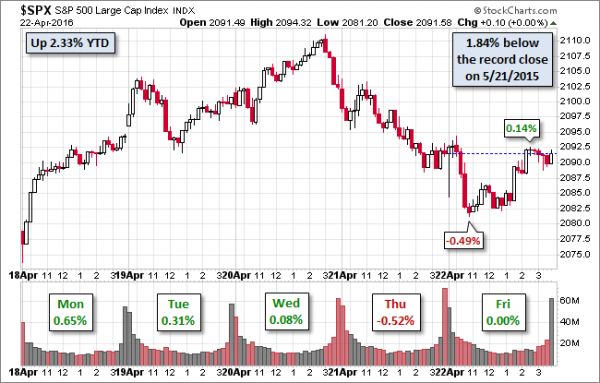
The entire post adds more analysis on volatility, moving averages, volume, and long-term context. Doug’s update also provides multi-year context.
We would all like to know the direction of the market in advance. Good luck with that! Second best is planning what to look for and how to react. That is the purpose of considering possible themes for the week ahead. You can make your own predictions in the comments.
This Week’s Theme
The economic calendar includes plenty of news. The FOMC is meeting. While no policy change is expected, everyone will closely watch the language in any statement. It is also a big week for corporate earnings. If the week begins on a positive note, CNBC will have a countdown to a new record high. If not, there will be discussion of the “failed rally” in stocks. Either way I expect attention to center on the following question:
Will stocks finally make a new record high?
Background
Nothing really good happened last week, but the stock market reaction was modest. The “sage observers” say something like, “It just doesn’t want to go down.” Some might conclude that expectations are modest. Last week was a good illustration of how anticipation and positioning of “hot money” can affect the reaction to news. Brian Gilmartin explains how this might be relevant for a key part of the story in the week ahead – Apple (NASDAQ:AAPL) earnings. It is a great overview for the earnings week ahead.
Viewpoints
The basic themes, moving from bearish to bullish, range from astonishment to modest confidence.
- The levitation in stocks continues. The Wile E. Coyote moment is near!
- The worldwide economy threatens to drop into recession.
- Earnings have been engineered. Just look at sales for the truth.
- Technical indicators show that stocks are about to move lower.
- Technical indicators show that stocks are about to move higher.
- Not much was expected from this earnings season. The market is looking ahead.
- The economic data have not been great, but the recession threat has lifted.
- This could be a trough in the economy and corporate earnings. Stocks will respond.
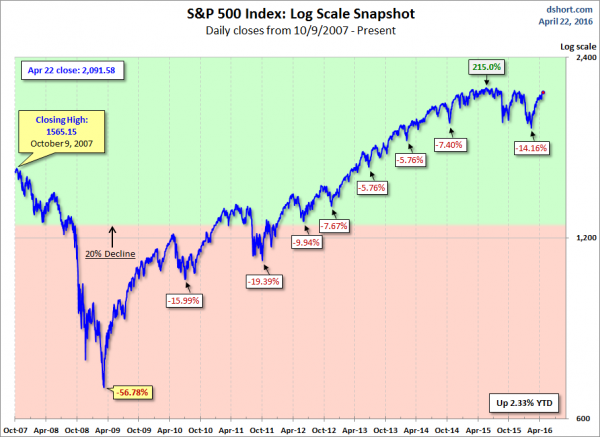
It is easy to find disciples for each viewpoint, including those earnestly following similar methods. Here is the challenge, from the weekly Doug Short summary. You can readily see the challenge of the old highs.
As always, I have my own opinion in the conclusion. But first, let us do our regular update of the last week’s news and data. Readers, especially those new to this series, will benefit from reading the background information.
Last Week’s Data
Each week I break down events into good and bad. Often there is an “ugly” and on rare occasion something really good. My working definition of “good” has two components:
- The news is market-friendly. Our personal policy preferences are not relevant for this test. And especially – no politics.
- It is better than expectations.
The Good
There was a little good news.
- Hotel occupancy rates are tracking close to last year’s highs. (Calculated Risk)
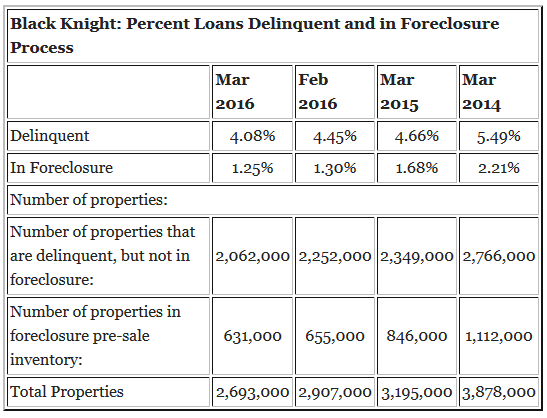
- Mortgage delinquency rates are the lowest in nine years. (Calculated Risk)
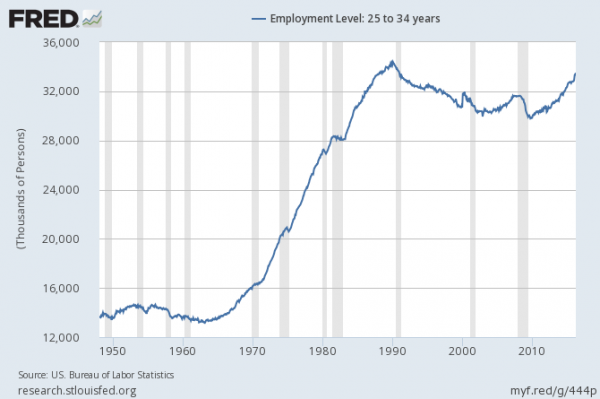
- Jobless claims dropped again to a 42 ½ year low. (HT BBRO) And contrary to many opinions, the job growth in the 25-34 age cohort is stronger.
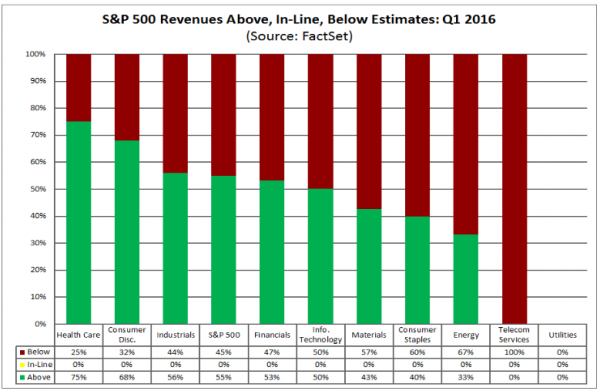
- Earnings reports were mixed. FactSet reports that the earnings beat rate is positive, but below the five-year average. A common story is a company beating on the bottom line, but missing on sales, also slightly worse than the five-year average. Outlooks are better than average and the market rewarded beats more than it punished misses.
- Existing home sales improved. Calculated Risk is our top source on housing. Bill describes it as a good start to the year.
The Bad
Most of the news was negative.
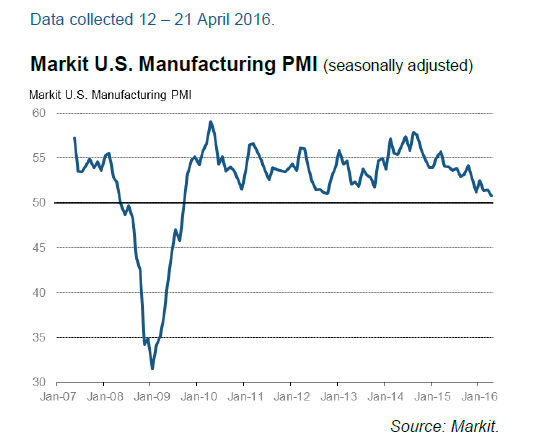
- Markit PMI data suggested weakness in manufacturing. James Picerno explains and provides the chart below. He also contrasts the results with the ISM manufacturing index, and various regional measures. I urge you to read the entire post. This is why I try to pick the most important indicators instead of adding to the noise by citing everything. Markit is attempting to establish a market for their data, even though the history is very short. They have to start somewhere. Unlike the ISM data, the results are very difficult to interpret. I am especially suspicious of worldwide results, where the sample sizes, margin of error, and response rate are not reported. We are always hungry for data, so we uncritically accept whatever there is.
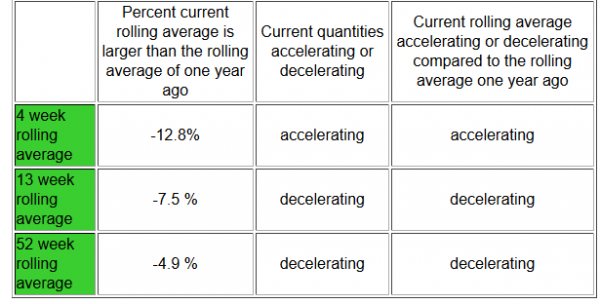
- Rail traffic continues the decline. Steven Hansen (GEI) slices and dices the data, examining year-over-year comparisons with special attention to coal, as noted in this quote:
Coal is over 1/3 of the total railcar count, and this week is 43.4 % lower than the production estimate in the comparable week in 2015. The middle row in the table below removes coal and grain from the changes in the railcar counts as neither of these commodities is economically intuitive.
- Trucking tonnage also declined. GEI also has this story, with a comprehensive look at the data and possible future revisions.
- The Philly Fed manufacturing index missed expectations and turned negative. More encouraging was the outlook portion of the report, which moved significantly higher. (BI)
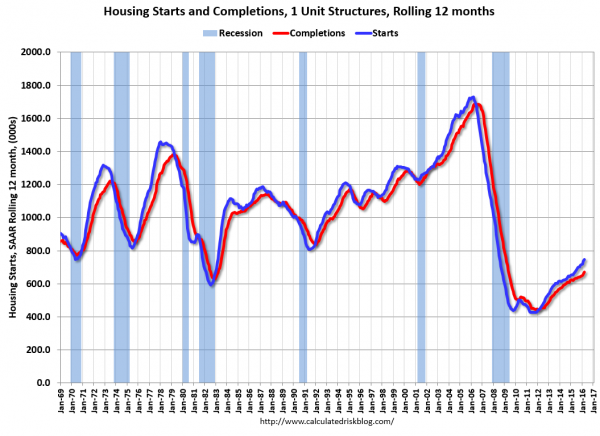
- Housing starts and building permits fell nearly 8%. Revisions mitigated the news a bit. (Calculated Risk)
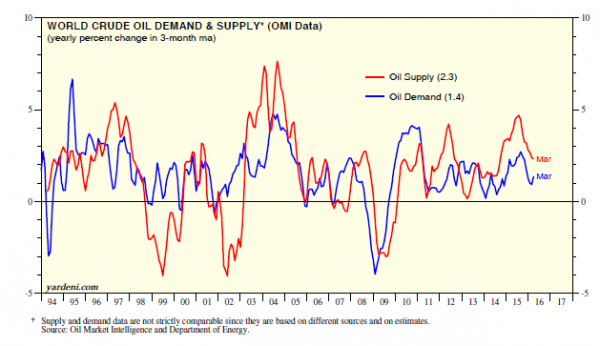
- Doha Conference failed. Ed Yardeni does a nice job in analyzing the resulting confusion, as well as the remaining fundamental gap between supply and demand.
The Ugly
“Dieselgate.” Volkswagen (OTC:VLKAY) announced a plan to buy back as many as 500,000 cars in the U.S. The cost of this program, plus fines and lost sales imply a cost far exceeding earlier estimates (Jalopnik). Barron’s puts the overall cost at $51 billion. The FT notes that there has been no reduction in headcount nor in the expected dividend.
Daimler (OTC:DDAIY) announced that it is doing an internal investigation at the request of the Justice Department. Mitsubishi (OTC:MMTOF) also admitted that it had falsified test data on 600,000 vehicles.
The Silver Bullet
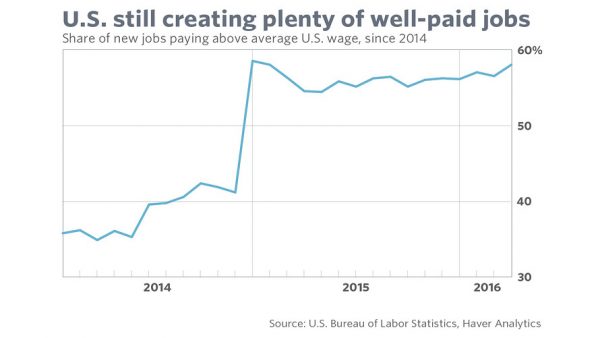
I occasionally give the Silver Bullet award to someone who takes up an unpopular or thankless cause, doing the real work to demonstrate the facts. Think of The Lone Ranger. This week’s award goes to Jeffry Bartash (MarketWatch). The popular misconception is that net job creation is all about part-time or low-paying jobs. The simplistic analysis often suggests that any manufacturing job is good and any service job is like burger-flipping. This is especially humorous when the article is written by a six-figure service worker! But I digress. It is always better to focus on data.
The story is not completely upbeat. The article provides a balanced assessment of recent trends. Here is a key point:
Noteworthy
People do not even understand Google (NASDAQ:GOOGL) search results, unable to distinguish ads. No wonder they cannot identify problems with stock charts, a topic I took up last week. If you missed the post, please check out my post about the most expensive investor misconceptions.
Quant Corner
Whether a trader or an investor, you need to understand risk. I monitor many quantitative reports and highlight the best methods in this weekly update. I recently made some changes in our regular table, separating three different ways of considering risk. For valuation I report the equity risk premium. This is the difference between what we expect stocks to earn in the next twelve months and the return from the ten-year Treasury note. I have found this approach to be an effective method for measuring market perception of stock risk. This is now easier to monitor because of the excellent work of Brian Gilmartin, whose analysis of the Thomson-Reuters data is our principal source for forward earnings.
Our economic risk indicators have not changed.
In our monitoring of market technical risk, I am now using our new model, “Holmes”. Holmes is a friendly watchdog in the same tradition as Oscar and Felix, but with a stronger emphasis on asset protection. We have found that the overall market indication is very helpful for those investing or trading individual stocks. The score ranges from 1 to 5, with 5 representing a high warning level. The 2-4 range is acceptable for stock trading, with various levels of caution.
The Holmes risk indicator improved from “mildly bearish” to “neutral”. We score this as 3 rather than 4 in the table.
The new approach improves trading results by taking some profits during good times and getting out of the market when technical risk is high. This is not market timing as we normally think of it. It is not an effort to pick tops and bottoms and it does not go short.
Interested readers can get the program description as part of our new package of free reports, including information on risk control and value investing. (Send requests to info at newarc dot com).
In my continuing effort to provide an effective investor summary of the most important economic data I have added Georg Vrba’s Business Cycle Index, which we have frequently cited in this space. In contrast to the ECRI “black box” approach, Georg provides a full description of the model and the components.
For more information on each source, check here.
Recent Expert Commentary on Recession Odds and Market Trends
Doug Short: Provides an array of important economic updates including the best charts around. One of these is monitoring the ECRI’s business cycle analysis, as his associate Jill Mislinski does in this week’s update. She cites a recent interview with ECRI co-founder Lakshman Acuthan who continues his anti-Fed theme that the current business cycle is a “Grand Experiment” but with flawed assumptions. The review of the ECRI is comprehensive and provides an interesting comparison with Recession Alert, one of our featured sources. Chart lovers will love this regularly updated article.
Doug’s Big Four update is the single best visual review of the indicators used in official recession dating. You can see each element and the aggregate, along with a table of the data. The full article is loaded with charts and analysis. As you can see, the indicators show a mixed picture, but not the conditions for a recession.
Bob Dieli does a monthly update (subscription required) after the employment report and also a monthly overview analysis. He follows many concurrent indicators to supplement our featured “C Score.”
RecessionAlert: A variety of strong quantitative indicators for both economic and market analysis. While we feature the recession analysis, Dwaine also has a number of interesting systems. These include approaches helpful in both economic and market timing. He has been very accurate in helping people to stay on the right side of the market. This week Dwaine has an update on the labor market which he describes as “not as strong as you think.”
Georg Vrba: provides an array of interesting systems. Check out his site for the full story. We especially like his Business Cycle Indicator, updated weekly and now featured in our table. Georg also has an unemployment rate recession indicator. This has long confirmed that there is no recession signal. What would it take to change the prognosis? In this interesting post he suggests that an increase of 0.3% in unemployment would warn of a recession.
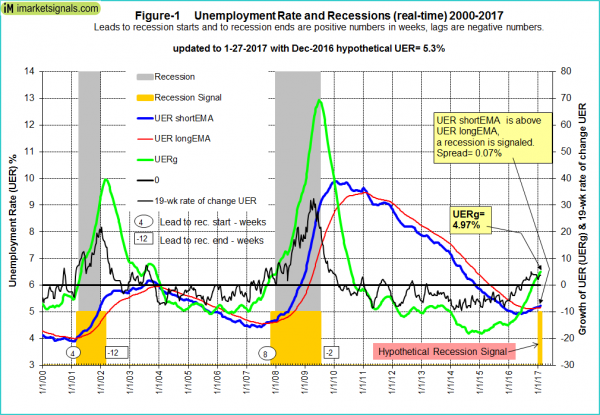
Bob Dieli’s analysis is similar, but dependent on the source of the change in employment.
While on this theme, we should recall a recent post from Philosophical Economics, suggesting that the “perfect recession indicator” focused on change in the unemployment rate, not the level. This is probably similar to what Bob concluded.
The Week Ahead
We have an average week for economic data, with an emphasis on housing reports. While I highlight the most important items, you can get an excellent comprehensive listing at Investing.com. You can filter for country, type of report, and other factors.
The “A List” includes the following:
- FOMC rate decision. (W). Even though there will be no press conference, no updating of forecasts, and no expectation of a change, the punditry will be watching!
- Personal income and spending (F). A crucial component of economic expansion.
- Michigan sentiment (F). Some distrust survey data, but there is no better way to discover current spending and employment trends.
- Consumer confidence (T). Almost as helpful as the Michigan data.
- New home sales (M). Housing remains important for economic expansion and new construction is the real test.
- Initial claims (Th). The best concurrent indicator for employment trends.
The “B List” includes the following:
- Core PCE prices (F). This is the Fed’s favorite inflation measure, so it will eventually be important. For now, inflation questions are on a back burner – something that could change quite suddenly.
- Pending home sales (W). Not as interesting as new homes, but still a good read on the market.
- Durable goods (T). Volatile March data, but still an interesting read on a key economic sector.
- Chicago PMI (F) The most significant regional index is always more important when released on a Friday.
Fed members will be quiet because of the FOMC meeting.
There will be a continuing focus on corporate earnings, with almost 40% of the S&P 500 reporting this week.
How to Use the Weekly Data Updates
In the WTWA series I try to share what I am thinking as I prepare for the coming week. I write each post as if I were speaking directly to one of my clients. Each client is different, so I have six different programs ranging from very conservative bond ladders to very aggressive trading programs. It is not a “one size fits all” approach.
To get the maximum benefit from my updates you need to have a self-assessment of your objectives. Are you most interested in preserving wealth? Or like most of us, do you still need to create wealth? How much risk is right for your temperament and circumstances?
WTWA often suggests a different course of action depending upon your objectives and time frames.
Insight for Traders
We continue both the neutral market forecast, but our overall rating recently moved to “neutral” from “mildly bearish”. Felix is still 100% invested. The more cautious Holmes continues to better the market while taking a lot less risk and is now close to 100% invested, after some profit taking. Holmes uses a universe of nearly 1000 stocks, selected mostly by liquidity. Even when the overall market is neutral, there will often be some strong candidates. Holmes holds a maximum of 16 positions at one time. For more information about Felix, I have posted a further description — Meet Felix and Oscar. You can sign up for Felix and Oscar’s weekly ratings updates via email to etf at newarc dot com. They appear almost every day at Scutify (follow here). I am trying to figure out a method to share some additional updates from Holmes, our new portfolio watchdog. (You learn more about Holmes by writing to info at newarc dot com.
Victor Niederhoffer has some great advice derived from checkers expert Tom Wiswell, whom he met by chance in Central Park. The key idea is to reduce size in the face of uncertainty. While we do this routinely in our firm, most traders either sell the entire position or remain “all in.” The post led me to another page of Wiswell Proverbs. Traders and investors alike will enjoy these. It is difficult to pick a favorite, but here is a candidate;
ERRORLESS PLAY: In Chess and Checkers you can be ninety-nine percent right and still lose; one bad move can defeat ninety-nine good ones.
Which is your favorite?
Dr. Brett explains about the need to challenge your limits and learn new skills. Hint: You need to do more than stick with what worked in the past.
Pradeep Bonde has an excellent post on trading setups. This is a good checklist of conditions, helping the trader to maintain discipline. One of my favorites from the list is:
To anticipate a breakout look at stocks currently not undergoing momentum burst.
Stock should be in extremely low momentum phase for anticipation.
It can be a shallow pullback or consolidation in established momentum phase.
Holmes barked with enthusiasm when I read this to him!
Insight for Investors
I review the themes here each week and refresh when needed. For investors, as we would expect, the key ideas may stay on the list longer than the updates for traders. Major market declines occur after business cycle peaks, sparked by severely declining earnings. Our methods are focused on limiting this risk. Start with our Tips for Individual Investors and follow the links.
We also have a page summarizing many of the current investor fears. If you read something scary, this is a good place to do some fact checking. Pick a topic and give it a try. Feel free to suggest new topics if your “fear” is not on the list.
Many individual investors will also appreciate our two new free reports on Managing Risk and Value Investing. (Write to info at newarc dot com).
Other Advice
Here is our collection of great investor advice for this week. It was especially difficult to screen for WTWA since there were so many good articles. Please enjoy!
If I had to pick a single most important source for investors to read, it would be Bryan Caplan’s discussion of forty lessons in his forty years. I have met Bryan a few times at conferences and respect his approach. This is not a traditional source for investors. Good! While I would enjoy debating many of the items with him, I see many great lessons. Reading his list will expand your investment horizons. The first two are favorites:
1. Supply-and-demand solves countless mysteries of the world – everything from rent control to road congestion.
2. Almost anyone can understand supply-and-demand if they calmly listen. Unfortunately, the inverse is also true.
Stock Ideas
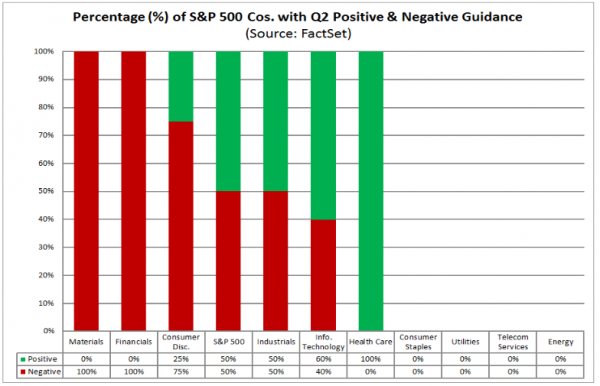
Which sectors have the most promising outlook? FactSet has interesting data. We still need to figure out how much is anticipated by current prices.
Opportunities in telecom stocks. After recently meeting the author, I have been following My Sunday Brief. Jim Patterson is the real deal, with broad expertise on telecom issues and a keen analytical sense. The question is how best to make use of this excellent information. This is not a source of specific stock tips like those commonplace in the financial press or seen on TV. That is good, because the field will not be crowded.
This week Jim writes about set-top box regulations, mentioning the implications for TiVo (NASDAQ:TIVO) and Comcast (NASDAQ:CMCSA). I am an early adopter of TIVO with multiple devices at home and the office. When I am in a hotel, I am frustrated by the inability to “listen lightly” or multitask, and then scroll back. Loving the product does not mean that you love the stock, of course. If you had a solid sense of the specific implications of the regulatory moves, you could act quickly as news emerged. You might also choose to anticipate regulations if the risk/reward was right. There is a lot of other interesting material, including the story of the controversial Sprint ad.
Aswath Damodaran, the leading expert on valuation, writes about Valeant (NYSE:VRX). Even if you are not interested in this stock, looking at his changes in valuation (from risky to attractive) is an education.
Strategy
Does it help to be contrarian? Two sources whom I regularly follow weigh in on this topic.
- Adam Parker talks to clients who all think they are contrarian, even though their views are similar.
- Morgan Housel identifies the risk, putting it in the context of recent market history.
This is a great topic – now on my agenda.
Personal Finance
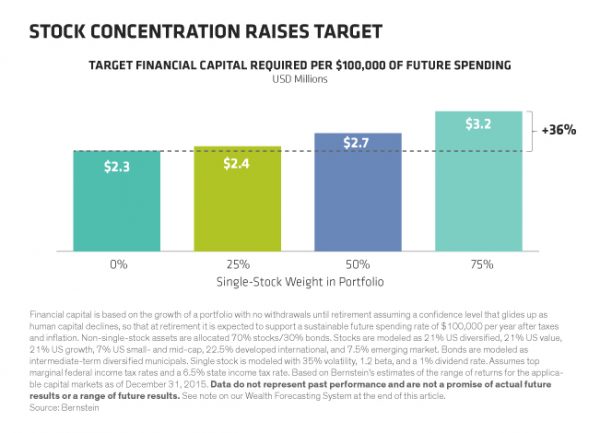
Professional investors and traders have been making Abnormal Returns a daily stop for over ten years. The average investor should make time (even if not able to read AR every day as I do) for a weekly trip on Wednesday. Tadas always has first-rate links for investors in this special edition. There are several great posts, but I especially liked the advice from Richard Weaver and Anne Bucciarelli about over-concentration in your own company’s stock. I have seen many sad stories of confident executives whose companies hit an unexpected stretch of hard times. The combination of possible job loss, salary reduction, retirement income loss, and declining option values can cast a pall over a comfortable future. (We provide a special options service to executives who need diversification, but cannot sell company stock).
Many people have high concentrations in company stock from retirement plans. It is important to know. Whatever the source, this chart shows the effect of excessive concentration.
Oil Prices
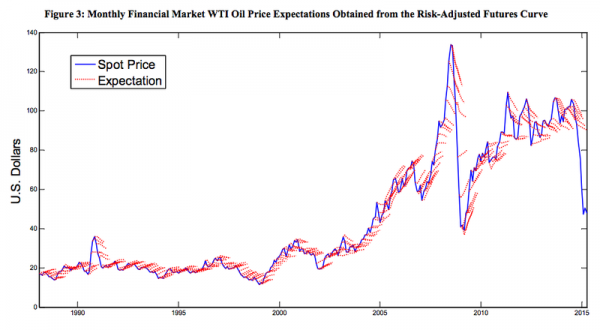
As has been the case for many months, you can find three kinds of oil experts:
- Those calling for higher prices (cuts in US production and greater investor confidence).
- Those who see lower prices ($20/barrel?)
- Those who can always explain after a move but cannot forecast accurately. (Vox summarizes some interesting academic research).
Group 3 is the largest!!
Watch out for….
FANG stocks. Last year it was difficult to beat the market without a significant holding in the Fab Four – Facebook (NASDAQ:FB), Amazon (NASDAQ:AMZN), Netflix (NASDAQ:NFLX), and Google (NASDAQ:GOOGL). Chasing last year’s winners is not a sound strategy. ETFdb asks whether Netflix is a sign of what is to come for these names. Hint: There are plenty of assumptions about growth built into current prices.
Final Thoughts
I certainly do not know whether the stock market will make a new record this coming week, but I expect it soon. We had a chance to buy stocks at “recession prices.” Now the market is closer to normal, but conditions are still improving.
Josh Brown notes how angry people are with the move back to Dow 18,000, something that most trader types see as unjustified. His advice (with which I agree)?
Anger at new highs or because of a correction or bear market is symptomatic of process-free investing. I know this from experience, and I’m thankful for this experience even though it felt terrible at the time. It taught me what not to do.
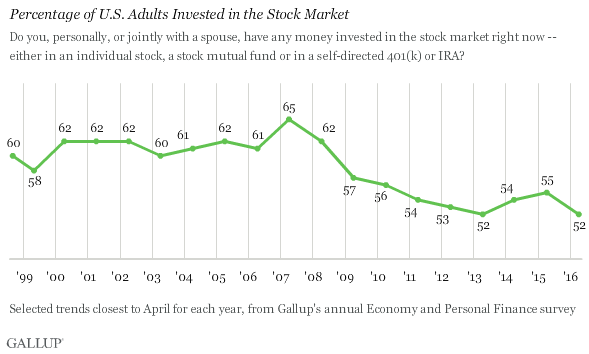
Regardless of what you hear from various sources most people are frightened and under-invested in stocks. The charts that most use to assert “investor confidence” are all candidates for the Silver Bullet award! Stock ownership (as a percentage of people) is the lowest in 19 years, the entire history of the Gallup survey. (Shawn Langlois)
Investment Take
We have been taking profits on stocks that hit targets and replacing with new selections. There are many candidates, and we go shopping on dips. We classify stocks three ways:
- Aggressive upside, but plenty of risk. You need to buy a basket, not a single stock.
- Great companies with great prospects, currently undervalued, but with potential catalysts.
- Stodgy, conservative names without a lot of upside. Great candidates for enhancing dividend yield by selling near-term calls.
Thinking about opportunities in this way is a good method for the individual investor.

