We have a normal week for economic data, and a big week for earnings reports. The last Presidential debate will grab headlines. We have been monitoring these factors for weeks, but something new is showing up in the data. Let’s call it a “stealth rotation” from bonds to stocks and from bond substitutes to less favored stocks. If the punditry carefully watches the data, they will be asking:
Has a market rotation begun?
Last Week
Last week’s news was pretty good, despite the negative reaction in stocks.
Theme Recap
In my last WTWA, I predicted special attention to the early earnings reports and questions about whether the earnings recession was ending. That was a reasonable guess, although most of the commentary seemed to focus on a couple of big earnings misses. There was also plenty of competition from some surprising China data, the ongoing Fed debate, and of course, the election news.
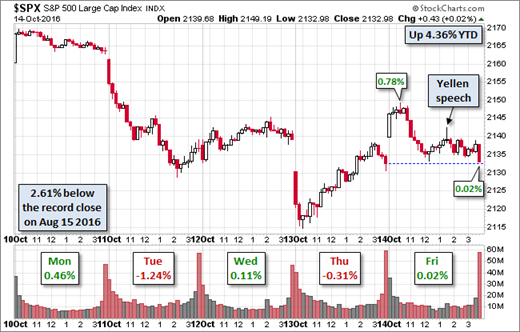
The Story in One Chart
I always start my personal review of the week by looking at this great chart from Doug Short. Stocks had a negative week. You can see the opening gap on Thursday after the Chinese trade data, and also Friday’s failed rally.
Doug has a special knack for pulling together all of the relevant information. His charts save more than a thousand words! Read his entire post where he adds analysis grounded in data and several more charts providing long-term perspective.
The News
Each week I break down events into good and bad. Often there is an “ugly” and on rare occasion something really good. My working definition of “good” has two components. The news must be market friendly and better than expectations. I avoid using my personal preferences in evaluating news – and you should, too!
The Good
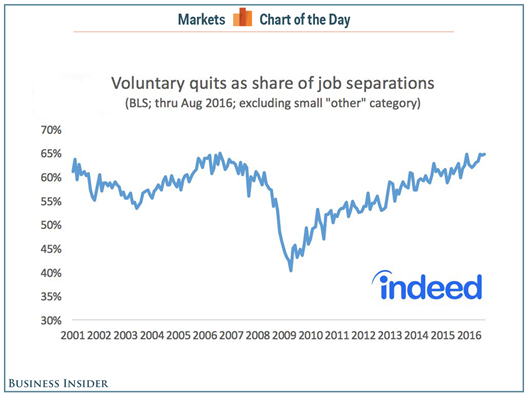
- JOLTS continues to show a solid labor market. Chair Yellen uses it as a signal for a tight labor market. The healthy “quit rate” shows that many people are comfortable in voluntarily leaving jobs. Some reports focused strictly on the number of job openings, which is a poor use of the data.
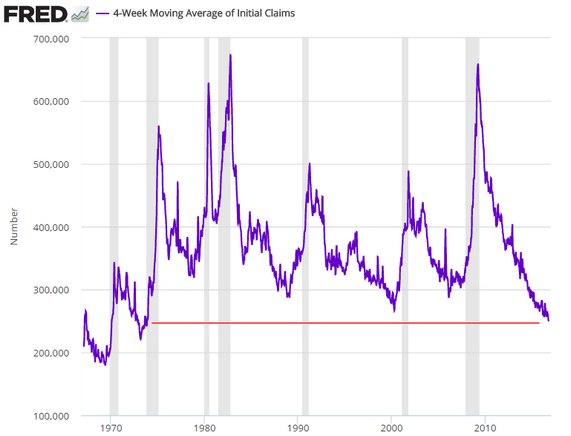
- Initial jobless claims also show labor market strength.
- Retail sales provided the week’s best economic news, rising 0.6%, the best increase in three months. (Bloomberg)
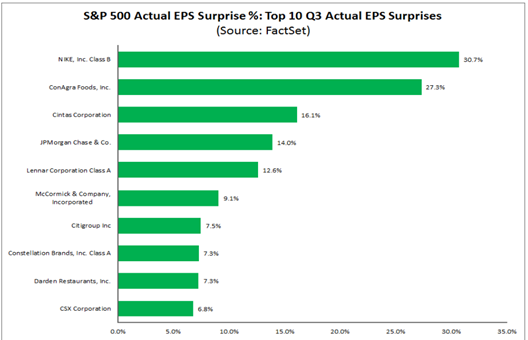
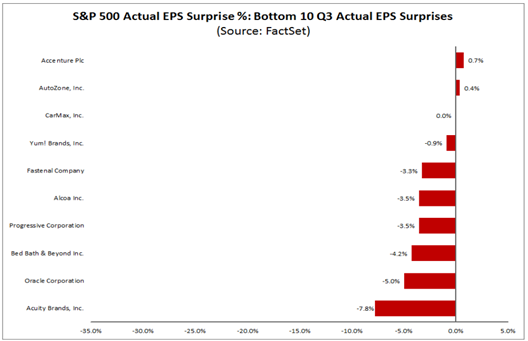
- Corporate earnings nicely beat expectations. FactSet has some interesting early data – 76% of the reporting companies have beaten earnings expectations and 62% have beaten on sales.
The Bad
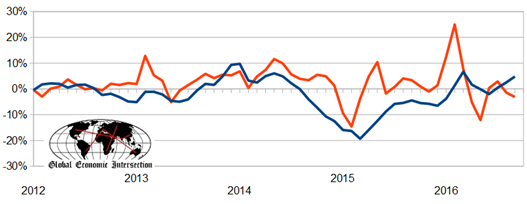
- Import container counts are again lower. Steven Hansen (GEI) smooths out the effects of the Hanjin Shipping bankruptcy and finds a troubling trend. Does it portend weak holiday spending? The chart below is the year-over-year change in the three month moving average.
- Chinese exports and imports both declined more than expected.
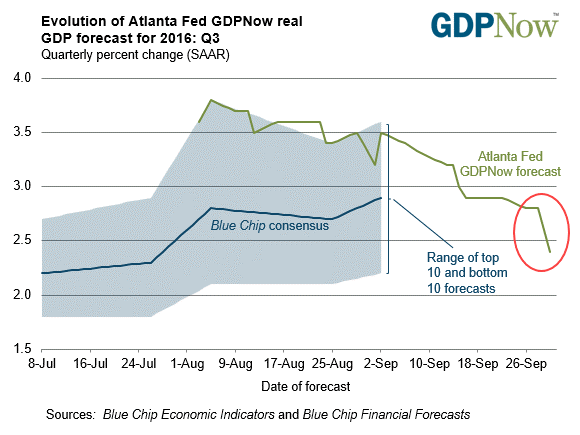
- Q3 GDP estimates edge lower as more data is reported. Calculated Risk summarizes the move from various sources. Here is one example:
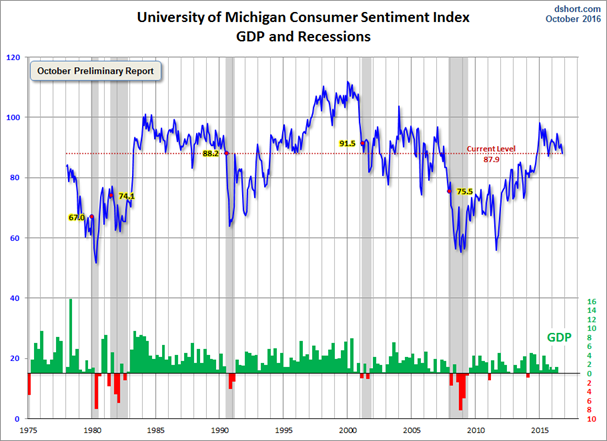
- Michigan consumer sentiment slips to 87.9 in the October preliminary report. Jill Mislinski updates the story and the terrific Doug Short chart combining multiple elements of the story in a single look.
The Ugly
The political sideshow. There were polls to determine the “winner” of the debate. Not so long ago debates were seen as a way for the trailing candidate to show equality of stature – same stage, same rules, etc. Many challengers have used this effectively. It is also a way to demonstrate that a “Presidential” image. If an expert from years ago, without any context, read the transcript of this “town hall forum” debate s/he would not believe it. Campaigns are ever-more focused on the undecided or uncommitted voters, especially in the key states. Suppose for a moment that these voters may not have been the ones sitting at the front of the class. What do we expect the campaigns to do? The sound bite negative ads are one approach, but this is reaching a whole new level – and not a high one.
The most important thing you can do as an investor is to vote your conscience while still using sound, unemotional judgement concerning your personal finances.
The Silver Bullet
I occasionally give the Silver Bullet award to someone who takes up an unpopular or thankless cause, doing the real work to demonstrate the facts. No award this week. Nominations welcome. I also note that Dr. Ed Yardeni joined us in applauding the Justin Lahart article on CAPE. Dr. Ed provides his own thoughts about market valuation and the advantages of forward earnings.
I am not a fan of valuation measures based on trailing earnings, especially if they trail over the past 10 years. I believe that the stock market is forward looking and discounts analysts’ consensus expectations for earnings over the year ahead. More specifically, I use S&P 500 12-month forward consensus expected operating earnings, which is a time-weighted average of analysts’ expectations for the current year and the coming one.
The Week Ahead
We would all like to know the direction of the market in advance. Good luck with that! Second best is planning what to look for and how to react. That is the purpose of considering possible themes for the week ahead. You can make your own predictions in the comments.
The Calendar
We have a fairly big week for economic data, as well as earnings reports. I watch everything on the calendar, so you do not need to! Check out WTWA to focus on what is really important – and ignore the noise.
The “A” List
- Housing starts and building permits (W). Important forward looking data on a crucial sector.
- Industrial production (M). Volatile September data. Any sign of a rebound from last month’s loss?
- Fed Beige Book (W). Prepared for the next FOMC meeting, this provides color from each Fed district, going beyond the data.
- Leading indicators (Th). Widely followed, despite some controversy. Rebound expected from last month’s negative reading.
- Initial claims (Th). The best concurrent indicator for employment trends.
The “B” List
- Existing home sales (Th). Without the impact of new homes, but still a good read on the overall housing market.
- CPI (T). Inflation is still not very important, and it will not be until there are a few higher months.
- Philly Fed (Th). Has earned some respect as one of the few regional indicators that can move markets. The first October data.
- Crude inventories (W). Often has a significant impact on oil markets, a focal point for traders of everything.
More important than the economic data will be continuing earnings news.
Next Week’s Theme
The Presidential campaign and the final debate continue to dominate the news. The regular economic data this week include important leading indicators about housing. These will not get the attention deserved. Corporate earnings reports will also get some attention, but the emphasis seems to be on spectacular “misses.” Did you even realize that the earnings season is positive so far? Unless you look at the FactSet data, you would not know.
Through this haze there have been a few glimmers of a new trend. If you are alert, you will see more attention to the question:
Has a market rotation begun?
There is some evidence.
- The 10-year note has moved noticeably higher while the yield curve has steepened.
- Utilities are losing ground while banks are gaining. Brian Gilmartin astutely asks, whether banks are assuming that role.
- Economic skepticism remains intense – but perhaps the result of the election. Chris Matthews (Fortune) notes that concern about the economy has grown even as data show improvement.
…a voter’s political beliefs and the overall political environment instead drives how they feel about their economic circumstances.
There’s no better way to interpret the latest results from the latest Marketplace-Edison Research Poll, which showed that 30% percent of Americans are very fearful they will lose their job in the next six months, up 10% from last year.
And also….
A particularly telling figure in this year’s survey: While 37% of those surveyed said their personal economic situation has improved over the past year—versus 21.5% who said it got worse—just 30.3% said the overall economy improved. What’s more, 36.9% said it got worse.
If more people’s financial situation improved than deteriorated, why do more people think it’s the opposite for the economy in general?
As always, I’ll have a few ideas of my own in the conclusion.
Quant Corner
We follow some regular great sources and also the best insights from each week.
Risk Analysis
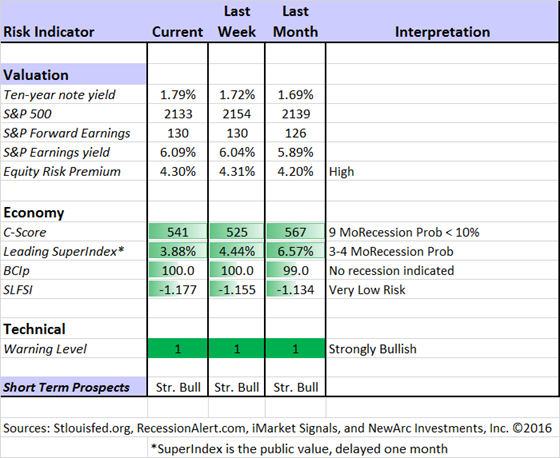
Whether you are a trader or an investor, you need to understand risk. Think first about your risk. Only then should you consider possible rewards. I monitor many quantitative reports and highlight the best methods in this weekly update.
The Indicator Snapshot
The Featured Sources:
Bob Dieli: The “C Score” which is a weekly estimate of his Enhanced Aggregate Spread (the most accurate real-time recession forecasting method over the last few decades). His subscribers get Monthly reports including both an economic overview of the economy and employment.
Holmes: Our cautious and clever watchdog, who sniffs out opportunity like a great detective, but emphasizes guarding assets.
Brian Gilmartin: Analysis of expected earnings for the overall market as well as coverage of many individual companies.
Doug Short: The Big Four Update, the World Markets Weekend Update (and much more).
RecessionAlert: Many strong quantitative indicators for both economic and market analysis. While we feature his recession analysis, Dwaine also has a number of interesting approaches to asset allocation.
Georg Vrba: The Business Cycle Indicator, and much more. Check out his site for an array of interesting methods. Georg regularly analyzes Bob Dieli’s enhanced aggregate spread, considering when it might first give a recession signal. Georg thinks it is still a year away. It is interesting to watch this approach along with our weekly monitoring of the C-Score. This week Georg also updates his unemployment-based indicator, still not signaling a recession as you can see from the chart below.
GEI reports that the ECRI’s growth index remains solid, despite a marginal fall last week. Meanwhile, the ECRI continues its prediction of “stagflation lite” and Fed criticism.
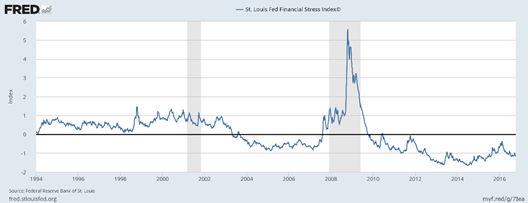
This is a good time to review the St. Louis Financial Stress Index – vastly superior to anecdotes and headlines.
How to Use WTWA (important for new readers)
In this series I share my preparation for the coming week. I write each post as if I were speaking directly to one of my clients. Most readers can just “listen in.” If you are unhappy with your current investment approach, we will be happy to talk with you. I start with a specific assessment of your personal situation. There is no rush. Each client is different, so I have six different programs ranging from very conservative bond ladders to very aggressive trading programs. A key question:
Are you preserving wealth, or like most of us, do you need to create more wealth?
My objective is to help all readers, so I provide a number of free resources. Just write to info at newarc dot com. We will send whatever you request. We never share your email address with others, and send only what you seek. (Like you, we hate spam!) Free reports include the following:
- Understanding Risk – what we all should know.
- Income investing – better yield than the standard dividend portfolio, and also less risk.
- Holmes and friends – the top artificial intelligence techniques in action.
- Why it is a great time to own for Value Stocks – finding cheap stocks based on long-term earnings.
You can also check out my website for Tips for Individual Investors, and a discussion of the biggest market fears. (I welcome questions on this subject. What scares you?)
Best Advice for the Week Ahead
The right move often depends on your time horizon. Are you a trader or an investor?
Insight for Traders
We consider both our models and also the best advice from sources we follow.
Felix and Holmes
We continue with a strongly bullish market forecast. Felix is fully invested. Oscar holds several aggressive sectors. The more cautious Holmes also remains fully invested. They now have a regular Thursday night discussion, which they call the “Stock Exchange.” This is the place to get some ideas from the best technical analysis – and you can ask questions!
Top Trading Advice
Brett Steenbarger reminds us that we should always consider what we would be doing if not trading. Is it a good choice? He also highlights an interesting trading contest for women. It leads both to prizes and to job opportunities. While performance is measured, the criteria do not encouraging taking wild shots. You can still apply, but do so right away if interested since the contest has started.
Do you have an edge in your trading? Do you have a tested, trusted system? Adam H. Grimes describes this important first step for traders as well as what they should do next.
If you don’t meet Adam’s tests, you should definitely re-read Dr. Brett’s post!
Insight for Investors
Investors have a longer time horizon. The best moves frequently involve taking advantage of trading volatility!
Best of the Week
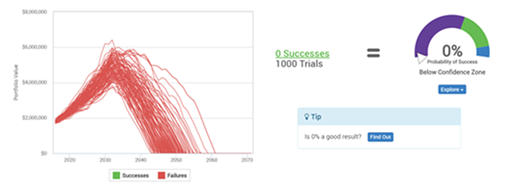
If I had to pick a single most important source for investors to read this week it would be Neal Frankle’s analysis of a client question about real estate versus stocks. In a generic sense, it is a common question faced by nearly everyone. Neal realizes that everyone’s situation differs. Using the couple’s investment goals and time frame, he compares three alternative choices. From this analysis one of the choices is easily eliminated. It is an excellent demonstration of sound contextual analysis. To appreciate the result, you should read the whole post. Here is an intriguing chart:
Stock Ideas
Chuck Carnevale’s most recent idea is CVS Health Corporation (NYSE:CVS). His analysis shows that the stock has moved from overvalued territory to fair value – and with plenty of upside.
Our newest trading model, Holmes, has joined our other models in a weekly market discussion. Each one has a different “personality” and I get to be the human doing fundamental analysis. We have an enjoyable discussion every week, with four or five specific ideas that we are also buying. This week Holmes likes Dexcom (DexCom Inc (NASDAQ:DXCM)). Check out the post for my own reaction. And his choice from last week, Air Products and Chemicals (NYSE:APD), has now been endorsed by Athena. Check out the post to see the other picks, ask questions, and choose your favorite model.
While we cannot verify the suitability of specific stocks for everyone who is a reader, the ideas have worked well so far. My hope is that it will be a good starting point for your own research. Holmes may exit a position at any time. If you want more information about the exits, just sign up via holmes at newarc dot com. You will get an email update whenever we sell an announced position.
Tom Armistead takes a deep dive into the numbers in his study of IBM (NYSE:IBM). Read his post to see why artificial intelligence is a crucial factor.
Lee Jackson recommends four dividend stocks from the defense sector. And also five contrarian picks with good yield.
Personal Finance
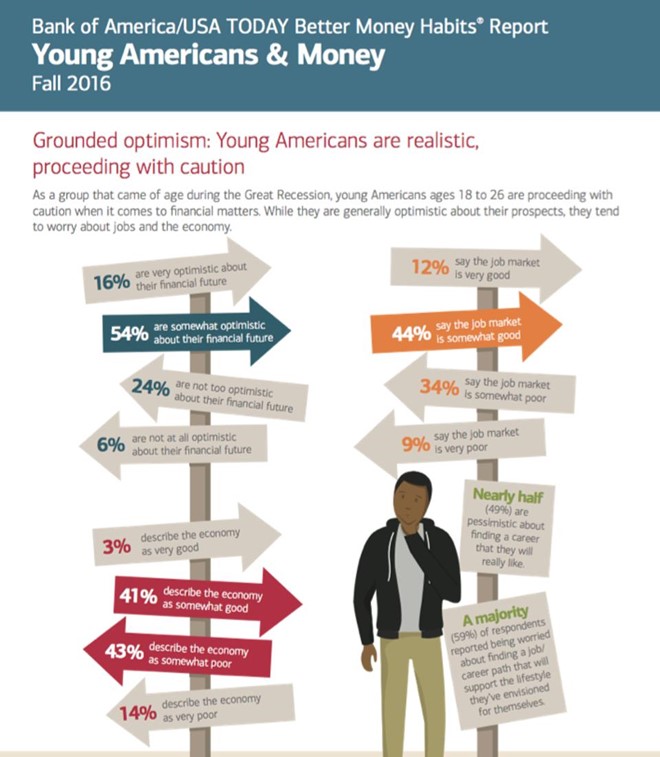
Professional investors and traders have been making Abnormal Returns a daily stop for over ten years. The average investor should make time (even if not able to read AR every day as I do) for a weekly trip on Wednesday. Tadas always has first-rate links for investors in his weekly special edition. There are always several great choices worth reading. My personal favorite this week is the Forbes report on a survey of young adults. It is a good read for young people and for investors wanting to understand current trends.
Gil Weinreich continues his excellent series for investment advisers, and of great interest to investors as well. He frequently features ideas about best practices for the advisor community. This week he introduced a new contributor, Neal Frankle. It is this week’s “best investment advice.” (And thanks to Gil for mentioning me along with others in his fine group).
Market Outlook
Mark Hulbert notes the seasonal strength typical of year’s end. Could there be a “monster rally?”
Final Thoughts
There is a continuing gap between perception and reality when it comes to economic progress and risks. This has translated into extremely defensive investment decisions, emphasizing anything that seems to provide yield. The incessant political accusations have made this worse.
The resulting environment encourages stories – even by unbiased journalists – seizing upon the dramatic. I am seeing the “R word” thrown around much more often, and by people without any special experience or track record.
The developing market rotation is still some weeks away from popular recognition, but there are signs it is getting closer. This Bloomberg interview with Tom Lee is well worth watching. Lee’s market read and forecasts have been excellent for years. He has remained bullish, and for the right reasons. I am encouraged when I see him commenting on the themes that I am also seeing.
One catalyst will be absolute losses in bond mutual funds. Investors are about to learn something important and possibly painful: Bonds and bond substitutes do not come with guarantees.

