
The SPX fell 1.5% Tuesday and then rose almost 1.5% on Thursday before closing lower again on Friday. In the process, it crisscrossed its 50-dma three times in four days. The indices were highly mixed for the week: SPX was down 0.8%, NNDX was down 1.9%, but RUT was up 1.2%.
Driving the fall in NDX was its largest component. Apple (NASDAQ:AAPL) fell 2.4%. Recall that Apple had risen 25% since the start of the year into the end of February. It has since fallen 8%. Here is the set up we shared at its recent high:

US equities have become extremely binary. Recall that NDX had risen 10 days in a row in February. Since its March 2 peak, it has fallen 6 out of 9 days. The SPDR S&P 500 ETF (ARCA:SPY) rose 3 weeks in a row and has subsequently fallen 3 weeks in a row.
The 7% push higher in SPY during February was driven by a simultaneous rally in oil and Treasury yields, both of which had bottomed at the exact low with equities (read here). Since the recent equity peak, oil has lost nearly 20% and Treasury yields have stalled.
Oil is, optimistically, working on creating a bottom. So far, it's following the well worn pattern from prior lows (described here): steep fall, failed rally to its 50-dma (arrows), a positive divergence in MACD (lower panel) as momentum attempts to turn neutral and reverse. There are now two bottoms almost two months apart (circles). When oil can regain a flat or rising 50-dma, it will have likely bottomed. Not yet. Until oil bottoms, it seems likely to weigh on US equities.

When SPY rises 3 weeks in a row, it generally continues higher 90% of the time for at least one more week. It hasn't done that this time. In fact, SPY hasn't been up 3 weeks in a row and then down 3 weeks in a row since 2005.
The pattern that is forming, where multi-week sequential gains (vertical lines) are quickly given back, is similar to three other periods: 2004, 2005 and 2011 (yellow). Each was part of an 8 month or longer period where equities largely moved sideways in a range. That continues to be our leading hypothesis about how 2015 will play out, making it quite unlike 2013 or 2014 (more here).
")
The lows in SPY this past week were right on the rising 20-weekly MA (center line). Observe that that line has held the lows (closing basis) consistently since 2013, with the exception of October 2014 and January 2015. When SPY closes below the 20-wma, it has headed to the lower Bollinger® Band or the rising trend line. Conveniently, those are now both near 200. A close lower next week will make this odds-on.

SPY ended the past week back inside its trading range from January and early February (blue solid lines, below). There's a possible double bottom at the lows on Wednesday and Friday; momentum in RSI (top panel) and MACD (bottom panel) is diverging, a positive heading into next week. If 204 (weekly S1) is broken this coming week, we would expect a move to 202 (S2) to fill the gap from February 3 (yellow shading). A fall to the bottom of the range would be equivalent to the weekly trend line and Bollinger Band described above.

A move lower to at least S1 sometime this coming week is slightly odds-on. According to Cobra, SPY has been down 3 weeks in a row 41 times since 1996 and it has made a lower intraday low the next week in 71% of those cases.
On the upside, 207 (Thursday's high) is obvious resistance. A close above that level and R1 or R2 (marked above) are the targets.
Overall, it's hard to say that SPY is trending. It, like NDX and DJIA, are at the same level as three months ago. The 50-dma is dead flat. Still, the pattern in daily RSI is consistent with recent lows (yellow shading). On a relative basis, the indices are oversold and downward momentum seems to be waning. If past is prologue, the next move should be upward.

Of the three big indices, NDX looks the best. It has held its "breakout" from its prior trading range (yellow shading). RSI has a positive divergence. Friday's low touched the 50-dma. A close below the 50-dma and a consequent fall like in October is quite possible. For now, this has the look of a backtest of the prior range. There's no foul.

RUT, the dog of 2014, is the star of 2015 so far, benefiting from a lower exposure to energy and foreign currencies. Like NDX, it has held its "breakout" and it closed last week near its ATH. This is healthy.

Breadth is nearing an extreme. It is already at levels associated with the lows in December and January. At Wednesday's low, less that 20% of SPX was above its 20-ema (middle panel). An extreme, and SPY bounced the next day. If less than 30% remains above its 50-ema (lower panel), SPY will be near a washout.

Similarly, one of our measures of breadth that uses the advance-decline percent for SPX reached an extreme this past week (lower panel). These extremes are normally near lows, although a second capitulation lower sometimes follows later.

Some of the recent extremes in bullish sentiment eased this past week, and fund inflows were less than $1bn. On Friday, equity only put/call ratios spiked to 0.8, indicating investor fear. This has happened 15 times in the past 3 years and SPY has closed higher within 5 days 87% of the time for an average gain of 1.2%.
Similarly, Sentimentrader's Optix indicator for SPY, based in part on fund flows and put/call ratios, is now at a level consist with recent lows.

(Longer-term measures of sentiment, like BAML, Investors Intelligence and the Fed's Z1, show excessive bullish sentiment. Again, this is likely to limit upside until a more significant correction takes place).
The upcoming week is Triple Witching. This has historically been a strong week for SPX: it has closed higher 6 of the last 7 years and 75% of the time over the past 20 years (data from Stock Almanac).

The big event of the upcoming week is an FOMC meeting on Wednesday. Of interest will be hints on the timing of any future increase in the Federal Funds rate. A heads up: the last FOMC meeting in late January was at the low, ahead of a one-month power rally, a consideration on weakness early next week. Our view is that a rise in rates is not supported by current macro data.

Market participants seem to be expecting the word "patience" to be removed from the Fed's statement on rates. On a "surprise" decision to remain patient, one casualty could be the Dollar.
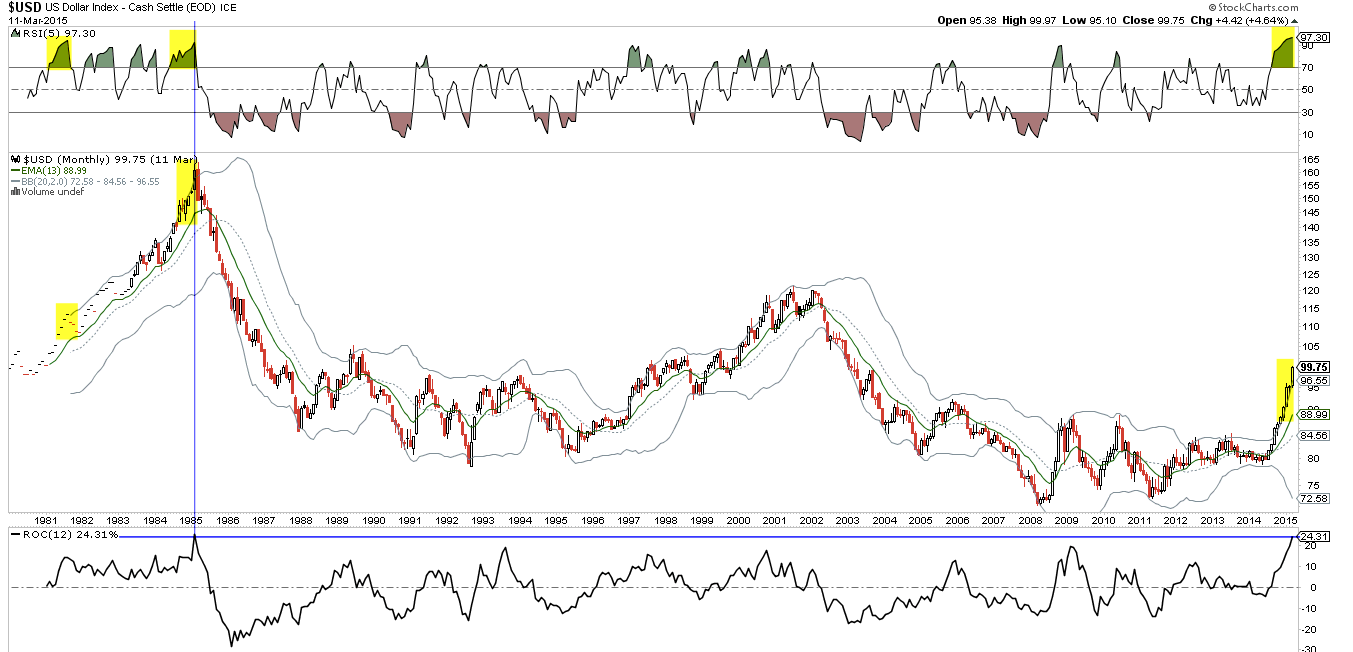
Over the past year, the rate of appreciation in the Dollar Index has been the greatest since 1985, the year the dollar peaked (lower panel). At least part of the reason for this appreciation is the change in interest rate spreads between the US and the rest of the world, especially Europe. If remaining patient implies a lower spread, the dollar could sell off (read further here).
In summary, the current set-up is this: SPY is testing its key rising 20-wma and NDX and RUT are back-testing their "breakout" levels. All of these have held. Some shorter term measures of sentiment indicate investor fear has risen. Breadth has fallen to a level within range of recent lows in equities. Seasonality is a strong positive this week. And, finally, an FOMC meeting on Wednesday has the potential to be a strong positive catalyst.
Our weekly summary table follows.
