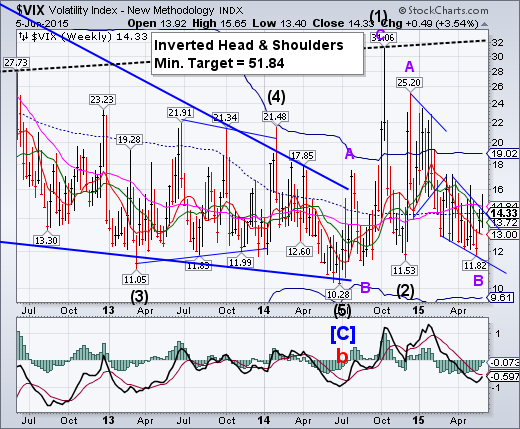
-- VIX broke out of its Ending Diagonal trendline and closed above weekly mid-Cycle support, giving it a confirmed sell signal for SPX. The anomalous earlier breakout is due to a Megaphone formation not visible on a weekly scale.
SPX has broken two major supports.
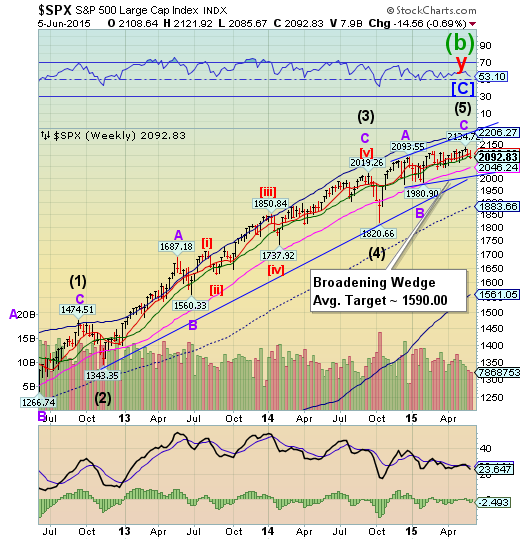
SPX has broken both its weekly Short-term support at 2100.83 and Intermediate-term support at 2096.87. The reason that both supports are so close is the sideways consolidation nearly merging them together. This leaves SPX vulnerable to a drop to or below the next (Long-term) support level at 2046.24 and the double trendlines near 2000.00 (also round number support).
Currently, there are things occurring that are very troublesome, and in more normal times, would likely already have investors heading for cover. However, in today's liquidity fueled, Central Bank supported environment, that has yet to be the case. The reason was best described recently by Dr. Robert Shiller:
"I call this the 'new normal' boom — it's a funny boom in asset prices because it's driven not by the usual exuberance but by an anxiety."
In other words, it is not exuberance about the strength of the economy, job security and global stability that is providing investors with the confidence to plunge into markets. It is the "anxiety" of missing out on further gains. This anxiety has been fueled by Central Banks, which continue to create a liquidity driven environment. The excess liquidity has manifested itself in surging levels of subprime auto loans, student debt, corporate share repurchases, rising levels of margin debt and record levels of mergers and acquisitions.
NDX closes at support.
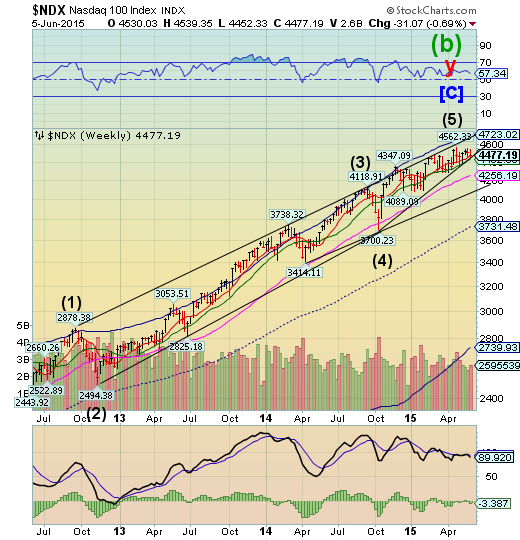
NDX closed just above its weekly Short-term support and Ending Diagonal trendline at 4472.80. It has been advancing just above those supports for the past 5 weeks. A break of that support would imply a complete retracement to its October 15 low at 3700.23.
(Forbes) The U.S. market is showing severe signs of IPO constipation. There are 104 companies currently on our Triton Research IPO Watchlist, including all of the “unicorns” that continue to attract investor interest the private market. But U.S. tech companies have overwhelmingly opted to avoid IPOs, raising money privately instead. And the lack of IPO filings indicate it will stay that way in the near term.
U.S. technology companies have already raised more money this year in the private market than in the public market in all of 2014 (excluding Alibaba’s nearly $22 billion IPO, which is by any definition an outlier). The 25 tech IPOs in 2014 (again excluding Alibaba (NYSE:BABA)) raised a total of $6.5 billion, less than the $7.8 billion already raised privately by US tech companies this year.
High Yield Bonds are losing their froth.
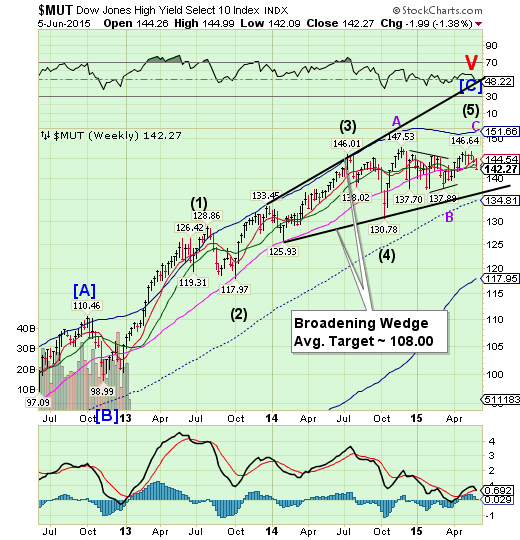
The High Yield Index failed in its final attempt at bettering its November 28 high at 147.53, leaving a truncated final wave. This week, it broke down beneath critical long-term support at 142.76. The next target is the lower trendline of its Broadening Wedge. It is also due for a major low by early July.
(MarketRealist) Investor flows in high yield bond funds turned negative last week. According to Thomson Reuters (NYSE:TRI) subsidiary Lipper, net outflows totaled $111 million in the week ended May 29. In comparison, there were net inflows of $906 million in the week ended May 22. On a year-to-date basis, high yield bond funds have witnessed net new cash of about $7.5 billion.
(CNBC) One of the world's leading private market investors still thinks that some bonds and loans are dangerously priced.
"Sub-investment grade corporate credit markets are as frothy as they've been," Joe Baratta, Blackstone (NYSE:BX) Group's global head of private equity, said Tuesday at the Wall Street Journal Private Equity Analyst Conference in New York.
The euro is still testing its support.
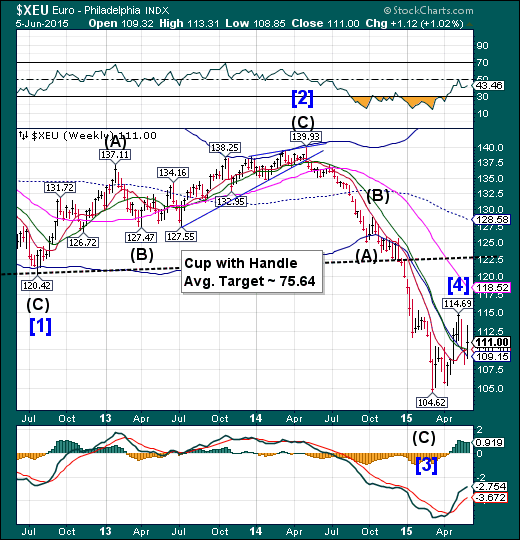
The euro staged a bit of a comeback this week, bouncing off its declining weekly Intermediate-term support at 109.15. This week, it experienced a brief inversion, as rumors circulated about a solution to the Greek crisis. We may see the euro resume its decline through mid-June.
(Bloomberg) With inflation back on the agenda, euro bears are losing faith in their predictions for the single currency to fall to parity -- or beyond -- with the dollar.
While the euro has tumbled on Friday, it’s still up 1.2 percent this week at $1.1122 after a rally that included the biggest two-day gain since 2009, and accelerated when European Central Bank President Mario Draghi said price growth was returning to the economy. Rabobank Group and Mizuho Financial Group Inc. (NYSE:MFG) boosted their year-end forecasts this week to $1.06 and $1.11, from previous estimates of $1.05.
Euro Stoxx breaking down.
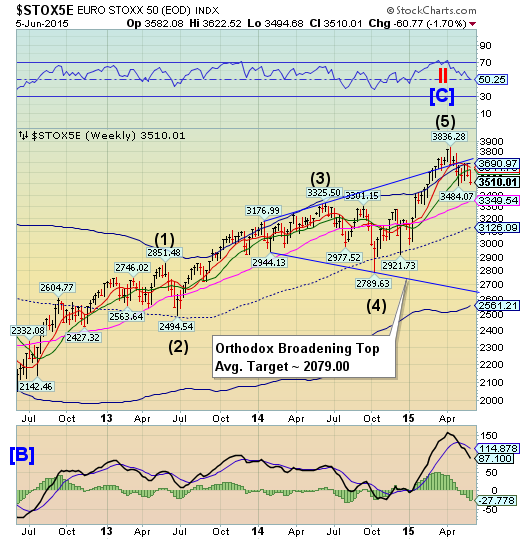
EuroStoxx 50 lost its Intermediate-term support at 3631.42, and may be destined to test its Long-term support at 3349.54 very soon. It is on a sell signal that may last through the month of June. A panic decline through the end of June may be about to begin.
(WSJ) European stocks and Greek assets fell sharply on Friday, capping off a wild week for markets around the globe.
The Stoxx Europe 600 ended the session down 0.9%, taking its losses this week to 2.6%.
Greek assets also suffered steep declines after the government decided to bundle its loan repayments to the International Monetary Fund this month into one payment at the end of June.
The yen is challenging its Cycle Bottom.
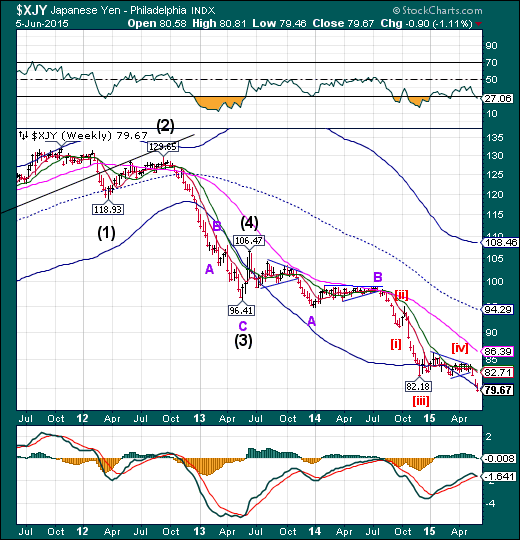
The yen broke beneath its Cycle Bottom support this week, suggesting that the decline has entered its final phase. The Cycles Model suggests a probable end to the decline by next weekend.
(WSJ) Japanese officials have made conflicting comments on currency policy in recent days, underlining the dilemma Tokyo faces: A weaker yen is good for the nation’s economy, but could complicate its relationship with the U.S.
The dollar’s climb this week to a fresh 12-year high against the yen is generally welcomed by Japan’s policy makers and leading exporters, such as Toyota Motor Corp (NYSE:TM). The yen’s fall has boosted exports and earnings at many companies, a result of stimulus policies engineered by the government of Prime Minister Shinzo Abe to spur growth and end deflation. Betting that corporate profits will continue to rise, investors have sent Japanese stocks to their highest levels in over a decade.
The Nikkei makes a new high at 20619.61.
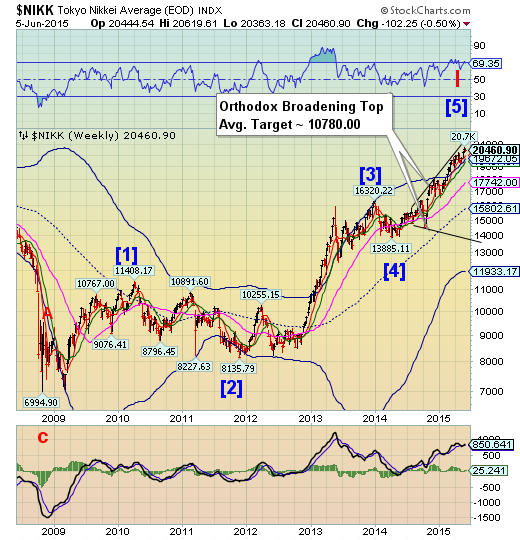
The Nikkei made a new high (not seen since 2000) last week in an inverted Cycle high. This week, it stalled beneath the high, showing uncertainty. Cycle inversions often come at the end of a long period of strength, such as that witnessed in the Nikkei. A loss of Short-term support at 19672.05 may warn us of an impending reversal.
(Reuters) Japan's Nikkei share average fell on Friday, after U.S. and European shares languished, as investors stayed cautious before the release later in the day of U.S. jobs data that might give a clue to the timing of an increase in U.S. interest rates.
The Nikkei 225 dropped 0.5 percent to 20,396.23 in midmorning trade, moving away from a 15-year high of 20,655.33 hit nearly a week ago.
Investors are focused on U.S. jobs data, expected to show a 225,000 gain in non-farm payrolls, according to a Reuters estimate.
U.S. dollar closes at Short-term support.
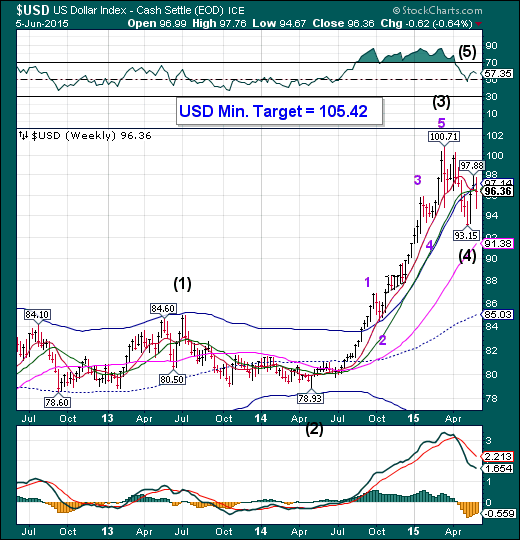
The US dollar nearly regained its Short-term support after retracing 68% of its recent gains. The next probe higher is likely to break out above its high at 100.71. The next leg of the rally may last through the end of June, but may revive again later in July, after an expected Trading Cycle low
(Reuters) - Speculators boosted bullish bets on the U.S. dollar for a second straight week to the largest in more than a month, according to Reuters calculations and data from the Commodity Futures Trading Commission released on Friday.
The value of the dollar's net long position rose to $34.15 billion in the week ended June 2, from $29.94 billion the previous week. It was the first time in four weeks that net dollar longs came in above $30 billion.
To be long in a currency is to take a view it will rise, while being short is a bet that its value will decline.
USB is at Long-term support.
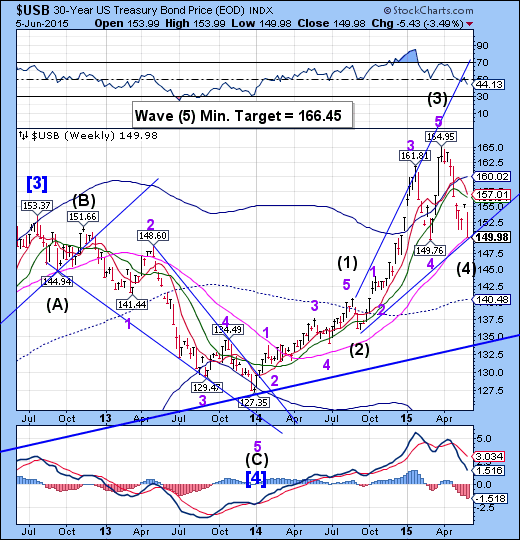
The Long Bond challenged its weekly Long-term support at 150.00, extending its Master Cycle low to Friday’s close. The Cycles Model now suggests a period of strength that may propel USB higher through the end of June. The minimum target for this rally appears to be 166.45. USB may go higher in this Broadening Wedge formation, but is being challenged by a nearly 34-year-long trendline.
(WSJ) Fresh signs of solid U.S. jobs growth and an uptick in wage inflation sparked a wave of selling in U.S. Treasury bonds, sending the yield on the benchmark 10-year note to an eight-month high.
Friday’s price decline capped the biggest one-week selloff of the bond market since June 2013, when the bond market was rattled by the taper tantrum, or fears over reduced bond buying from the Federal Reserve.
The yield on the benchmark 10-year Treasury note rose to 2.402%, compared with 2.309% on Thursday. It is the highest closing level since Oct. 6. Bond prices fall as their yields rise.
Gold loses Cyclical support.
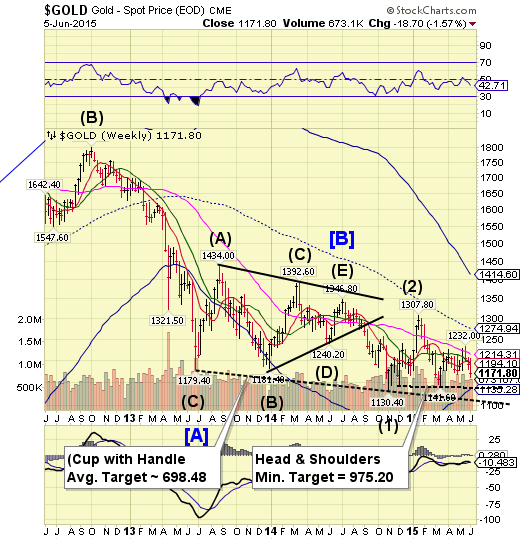
Gold lost its Intermediate-term support at 1184.17 and is due for a brief bout of extreme weakness this week. A probable decline beneath 1141.60 may develop, which may trigger the Head and Shoulders formation with a minimum target of 975.20. The Cycles Model now suggests a substantial low in late June.
(WSJ) Gold fell to its lowest level in nearly three months, after stronger-than-expected U.S. employment data reanimated speculation that the Federal Reserve would soon raise interest rates.
The most actively traded contract, for August delivery, fell $7.10, or 0.6%, to settle at $1,168.10 a troy ounce on the Comex division of the New York Mercantile Exchange. This was the lowest level since March 18.
Crude may begin its next decline.
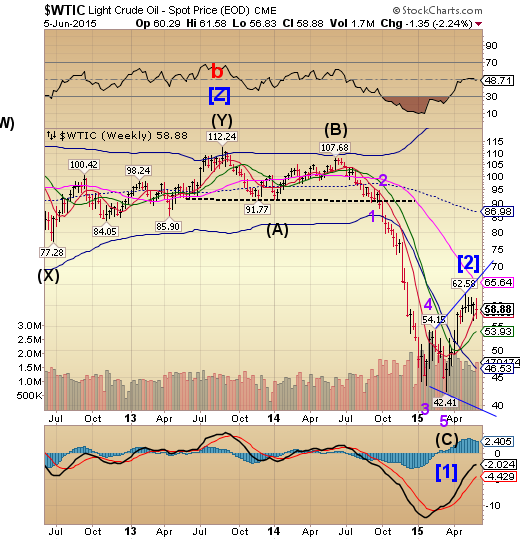
Crude challenged its weekly Short-term support at 58.30 on Friday, but closed above it. It appears to be preparing for a massive decline into mid-July once the supports are broken. The near-term target is 40.00, but it may descend considerably further.
(WSJ) Oil prices rose Friday on a drop in U.S. drilling, but posted a decline for the week as a stronger dollar and continued oversupply of crude oil weighed on the market.
Prices are more than 40% below their June highs, as the global market remains oversupplied. Traders are parsing supply-and-demand data from the U.S. and overseas for clues of when the market will come back into balance, either through lower production or improving consumption.
Market watchers remain divided about the near-term direction of oil prices. Some say prices will continue rising as demand keeps rising and U.S. shale-oil production falls following sharp cutbacks in drilling. Others say that the physical market remains oversupplied, with some cargoes of crude oil searching for buyers, and prices are set for another decline.
Shanghai Index punches higher amidst extreme volatility.
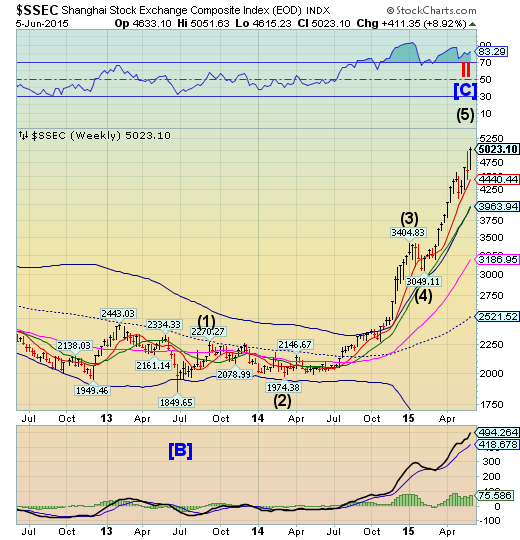
The Shanghai Index made a new high on Friday, capping a volatile week. The Cycles Model suggests a probable reversal early next week. It appears that this particular period of strength is almost over.
(ZeroHedge) After scaring millions of freshly created stock market speculators with a 10% 'correction' last week, it appears the PBOC's wealth-effect-creating, fix-the-leverage-overhang-with-temporary-stock-exuberance strategy was put into action with a record-smashing 4.4mm new accounts opened. Since Friday's lows, CHINEXT - China's tech-focused index - is up an astounding 16% (the largest ever 2-day swing). The Shenzhen Composite has also soared over 12% to fresh highs but we note the broadest-based Shanghai Composite has yet to make it back to last week's highs (even though it is up 9% from last week's lows).
The Banking Index probes its Cycle Top.
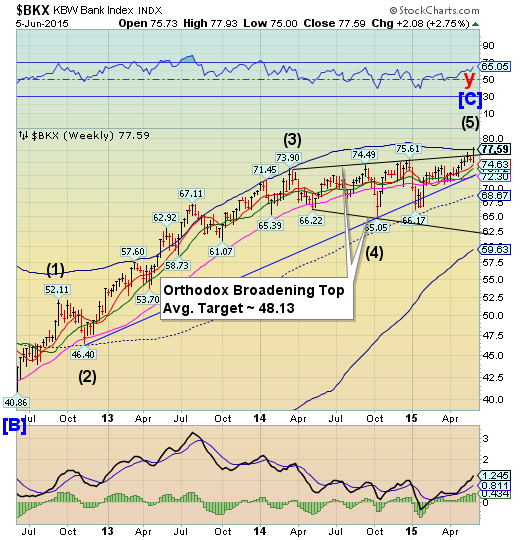
--BKX probed its Cycle Top resistance at 77.71 on Friday. This is the first such probe since March, 2014. Critical supports and its first bearish trigger lie at 72.90, where the 3-year Ending Diagonal trendline and weekly Intermediate-term support lie. This is an inverted Cycle Top. The Cycles Model now implies that BKX may decline through the end of June
(Bloomberg) U.S. banks are poised to score a victory in their fight to keep regulators from pinching the billions of dollars in fees they charge consumers who overdraw their accounts.
After studying overdraft fees for more than three years, the Consumer Financial Protection Bureau is leaning against subjecting banks to tough new rules that would cap the size of charges or limit how frequently they can be imposed on consumers, said two people briefed on the agency’s work.
(WSJ) Banks are having a happy Friday.
Strong job numbers for the month of May have lifted investors’ hope that the financial sector will soon finally see interest-rate relief from the Federal Reserve.
While the broader market ended down, the S&P’s financial index closed up 0.6%, with shares of many U.S. national and regional banks trading up on the good news. U.S. employers added 280,000 jobs last month, adding to a string of positive signs that may encourage the Fed to increase interest rates sooner rather than the later.
(ZeroHedge) While the Greek government believes it may have won the battle, if not the war with Europe, the reality is that every additional day in which Athens does not have a funding backstop, be it the ECB (or the BRIC bank), is a day which brings the local banking system to total collapse.
As a reminder, Greek banks already depends on the ECB for some €80.7 billion in Emergency Liquidity Assistance, which was about 60% of total deposits in the Greek financial system as of April 30. In other words, they are woefully insolvent and only the day to day generosity of the ECB prevents a roughly 40% forced "bail in" deposit haircut a la Cyprus.
