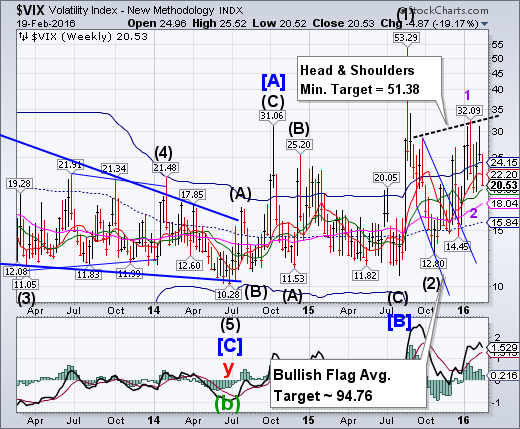
VIX pulled back toward weekly Intermediate-term support at 19.99. A trader using the VIX to signal the market’s intent would label this level as “neutral.” However, the buy signal (NYSE sell signal) may be confirmed with a rise above the Long-term resistance at 22.20. A breakout above the neckline suggests a very robust follow-through rally that may last up to a month.
(ZeroHedge) …More troubling for the bulls who are unable to get the much needed close of trading panic flush as a result of daily last hour levitations is Gundlach's call that the VIX needs to surge above 40 before a bottom can be made in the high-yield junk bond market. Today the VIX closed up 11% to 26.00, a long way off from the panic and revulsion that would send it north of 40. Indeed, the last time the VIX rose above that level was on August 24, when the VIX calculation actually was broken for a brief period of time to avoid crushing countless VIX-linked investors.
SPX testing Short-term resistance.
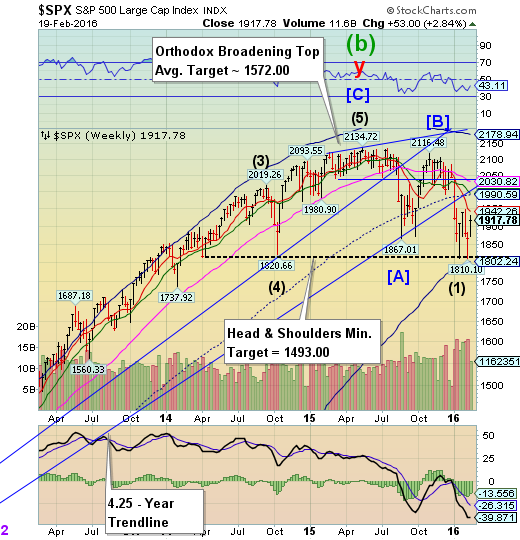
The SPX extended its bounce from the Head & Shoulders neckline toward weekly Short-term resistance at 1942.26. Volume was tepid, suggesting short-covering rather than new investors jumping in. The January bottom support at 1812.29 was broken and an open invitation for a retest should SPX fail to make a new high.
(Reuters) With next week's calendar full of economic data releases and speeches by economic policymakers, investors have been poised to watch the Federal Reserve for clues about the U.S. central bank's next move, but an unexpectedly hot reading on inflation on Friday will further sharpen that focus.
After coming into 2016 with an expectation of three or four interest rate hikes through the year, market participants recently were viewing the Fed as likely raising interest rates once, if at all, in light of weak inflation and global volatility.
But Friday's data showed the core consumer price index (CPI), a measure of underlying U.S. inflation, rose in January by the most in nearly 4-1/2 years to a 2.2 percent annualized rate. It drew particular attention as the number was above the Fed's 2.0 percent target, though it is not the central bank's benchmark inflation measure.
NDX records strongest week since July.
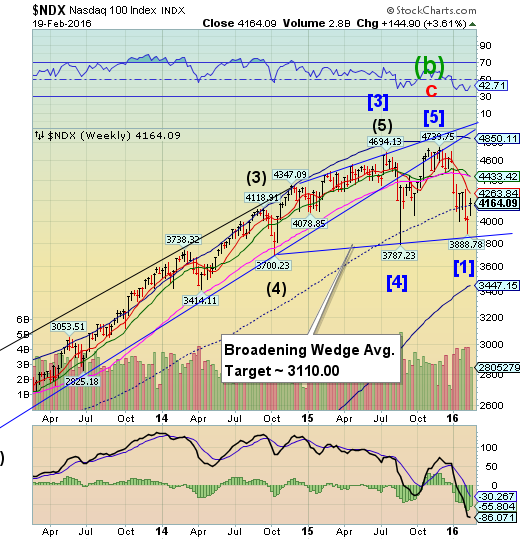
NDX bounced above weekly mid-Cycle resistance at 4148.63 and may challenge weekly Short-term resistance at 4263.84 this week. NDX appears to have formed a Broadening Wedge, similar to the Head & Shoulders formation in performance. Should selling resume, NDX may decline to 3000 or lower.
(NYTimes) Wall Street ended little changed on Friday as tech shares helped to offset a renewed drop in oil prices. Major indexes ended their best week of the year.
The Nasdaq rose about 0.4 percent, helped by a 7 percent jump in the chip equipment provider Applied Materials (O:AMAT) after the company gave a strong profit and revenue forecast for the current quarter.
Buoyed by big gains on Tuesday and Wednesday, the major indexes posted their best weekly performances this year, with the Nasdaq recording its strongest week since July.
High Yield Bond Index rises above its trendline.
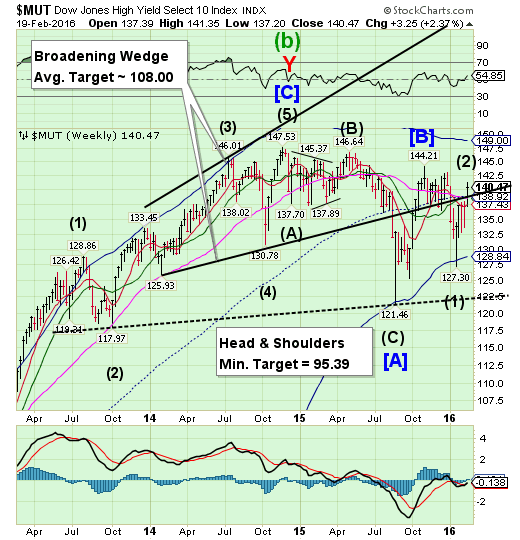
The High Yield Index rose above tis Broadening Wedge trendline near 139.00. MUT is no longer on a sell signal, but may resume that status next week by declining beneath the trendline and mid-Cycle support at 138.92.
(24/7WallSt) Through the first two months of the year, the trailing 12-month default rate on high-yield energy bonds is expected to reach 9%. Halfway through February, 11 high-yield bonds have defaulted, the most recorded during a one-month span since a similar number were chalked up in September 2009.
To date in 2016, 14 companies have defaulted, and another six are expected to default in March after missing February interest payments.
The euro pulls back to Long-term support.
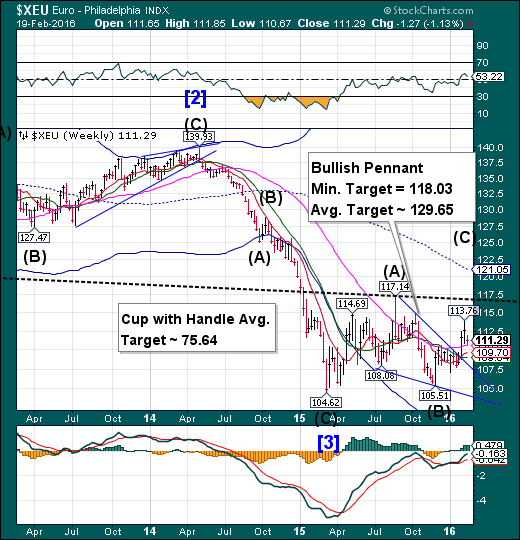
The euro consolidated above Long-term support/resistance at 110.63 this week, closing above it. The Cycles Model suggests a period of strength lasting through early March with the minimum Pennant target in reach. The Bullish Pennant provides the near-term target, while the Cup with Handle formation may be longer-term.
(ZeroHedge) Update: in case there was any doubt about the ECB's true intentions, we just got the official "denial":
DRAGHI: ANY ECB ACTION ON EU500 NOTE IS NOT ABOUT REDUCING CASH
Translation: the ECB action is only about reducing physical cash, some 30% of it to be specific.
The first shot in the global war on cash was just fired, by none other than the ECB, which moments ago Handelsblatt reported...
... and Bloomberg confirmed - ECB COUNCIL VOTES TO SCRAP EU500 NOTE: HANDELSBLATT - has voted to scrap the second highest denominated European bank note in circulation:
EuroStoxx bounces back its Cycle Bottom.
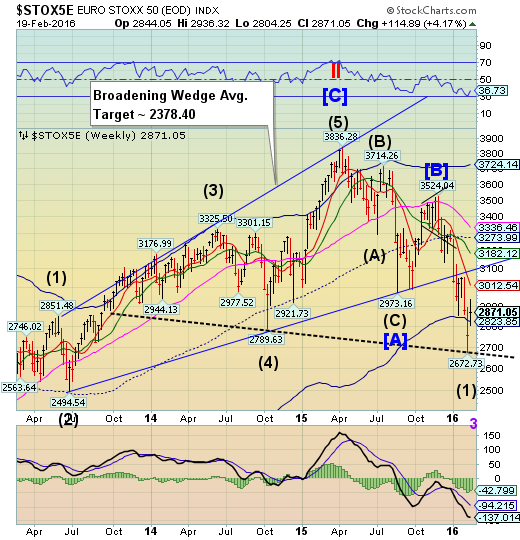
EuroStoxx bounced back above its Cycle Bottom support/resistance at 2823.85. It appears capable of retesting its short-term resistance at 3012.54 before resuming its decline. However, the decline may resume beneath Cycle Bottom support at any time, reinstating a probable sell signal. The Cycles Model suggests a panic decline may develop in the next 30 days.
(ZeroHedge) Having shown that the world is turning Japanese with tales of economic malaise, extreme monetary policy, and negative rates, Visual Capitalist's Jeff Desjardins shows that Germany, with its 5-year government bond currently trading at a -0.33% yield, is no exception to this story. However, negative yields are not the only concern that the country has in common with Japan.
It’s the overall demographic picture that is worrying, and it could have a big effect on Germany’s economic future as well as the tough choices that must be made today.
The yen may be ready to go higher.
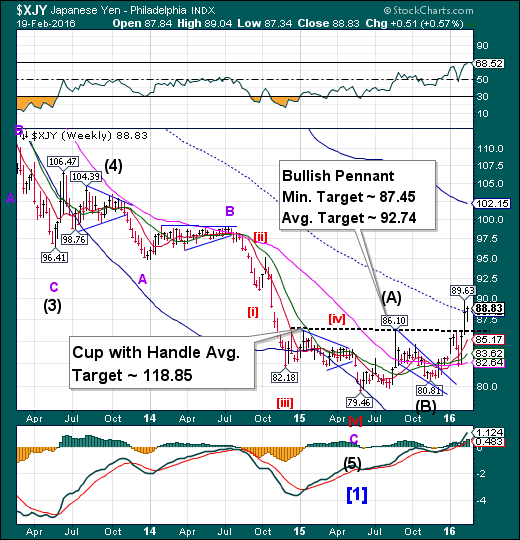
The yen completed its pullback with a ramp back above weekly mid-Cycle support/resistance line at 88.42. The immediate implication of a breakout is a probable rise to an average near 92.74 or higher. The Cycles Model suggests a potential period of strength lasting through the second week of March. The (short-term) pennant target may come in a matter of weeks, while the Cup with Handle target may take more than a month.
(NYT) When Prime Minister Shinzo Abe of Japan began a campaign three years ago to turn around his country’s economy, he took aim at areas as varied as taxes, trade and women in the workplace. The campaign, given the nickname Abenomics, relied heavily on one strategy: weakening the country’s currency.
Initially, it worked, as Japan’s stock market soared and corporate profits rose. But now that weapon is misfiring, and Abenomics may be in trouble.
Turmoil in global markets is making the yen rise in value again. That has resulted in big hits to the Japanese stock market and has raised worries among economists that Mr. Abe will not be able to deliver the economic growth his country needs to get back on track.
.The Nikkei bounces off round number support.
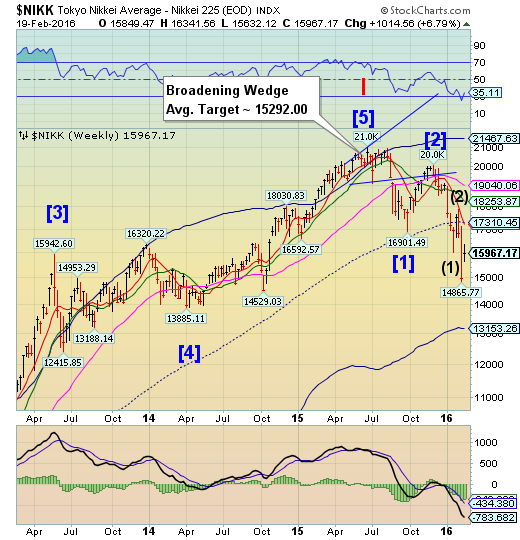
The Nikkei bounced off round number support at 15000.00 last Friday. The Cycles Model projects little further strength and may provide a Pivot reversal early this week.
(CNBC) Markets in Asia finished the final day of the trading week mixed, but major markets in Australia, Japan, South Korea, and China all registered a weekly gain.
The Japanese benchmark Nikkei 225 index Friday closed down 229.63 points, or 1.42 percent from Thursday, at 15,967.17. The index, however, gained 6.8 percent for the week.
The yen strengthened against the dollar with the dollar-yen pair falling 0.14 percent to 113.07 as of 3.10 p.m. HK/SIN time. Earlier, the pair fell to a session low of 112.69.
U.S. dollar fails a second retest of Long-term support/resistance.
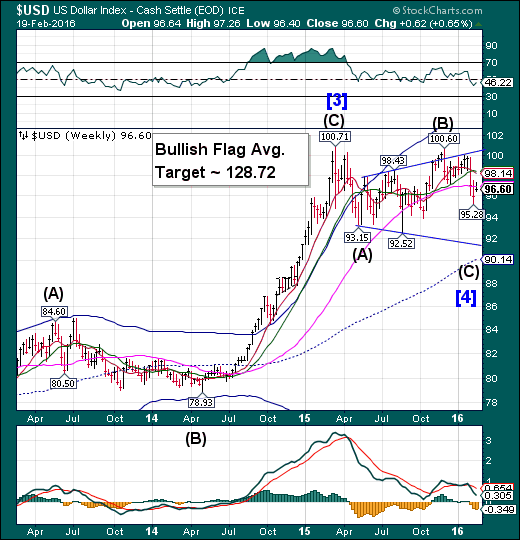
USD challenged Long-term support/resistance at 96.91 again, closing beneath it. The Cycles Model calls for a fast decline, possibly lasting only two weeks and falling as far as the lower trendline of the Broadening formation. Dollar longs may continue to be pummeled for the duration.
(Reuters) Bullish bets on the U.S. dollar retreated for an eighth consecutive week, with net longs falling to their lowest level since May 2014, according to Reuters calculations and data from the Commodity Futures Trading Commission released on Friday.
The global value of the dollar's net long position plunged to $8.31 billion in the week ended Feb. 16, from $12.60 billion in the previous week. Net dollar longs came in below $20 billion for a third straight week.
While investors continued to move out of the U.S. currency, largely increasing long bets on the Japanese yen, the dollar index managed to post its best weekly performance in about two months.
The dollar index measures the greenback against six major world currencies.
USB falls back from its Cycle Top.
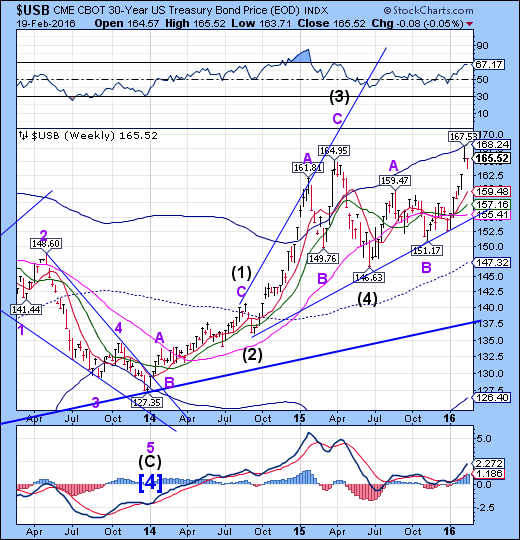
The Long Bond fell back from Cycle Top resistance at 168.24. The pullback may already be complete with at least one more probe to or above the Cycle Top. Over the next month we’ll be looking for the 34.4-year high in Treasuries. The long Treasuries trade is getting very crowded.
(Bloomberg) Wall Street’s biggest banks boosted their Treasury holdings to the highest level in more than two years, and one of them says that’s a warning sign for the market.
The 22 primary dealers including Goldman Sachs Group Inc (N:GS) and Citigroup Inc (N:C) that underwrite the U.S. debt and make a market in the securities held $113.5 billion of Treasuries in the week ended Feb. 10, based on the most recent central bank data. The amount is the most since October 2013.
(ETFTrends) Exchange traded funds that track U.S. Treasuries have attracted inflows for 10 consecutive weeks, the longest period in almost five years, as global volatility and economic uncertainty fueled safe-haven demand.
Gold is showing signs of a reversal.
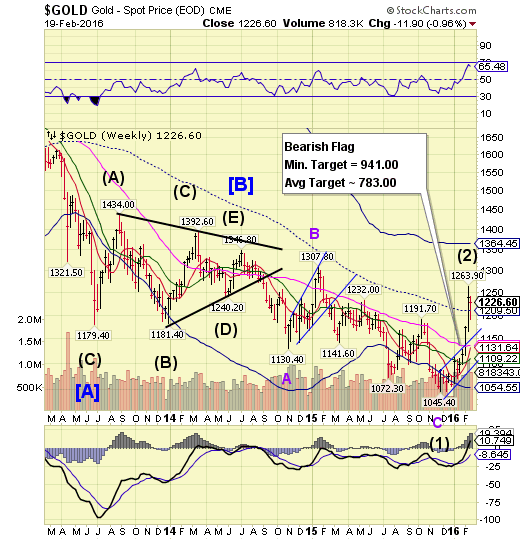
Gold pulled back from its 1263.90 high of an Ending Diagonal. However, it closed above mid-Cycle support/resistance at 1209.50. Once complete, Ending Diagonals are completely retraced, leaving this move as a false breakout to the downtrend. A decline beneath mid-Cycle support may signal a change in trend. Gold may be in for a very deep sell-off by the end of the month. Investor emotions are running high in the opposite direction.
(Barron’s) It’s like the gold rush all over again. The first wave of forty-niners to flood into California arrived mainly from the eastern United States. But gold fever soon turned global, and loads of fortune seekers from Europe and China emigrated to stake their claims.
Today, investors around the world are panning for gold via exchange-traded funds, and the growing availability—and popularity—of ETFs that own the actual metal for European and Chinese investors will help keep gold’s luster.
Crude challenges neckline resistance.
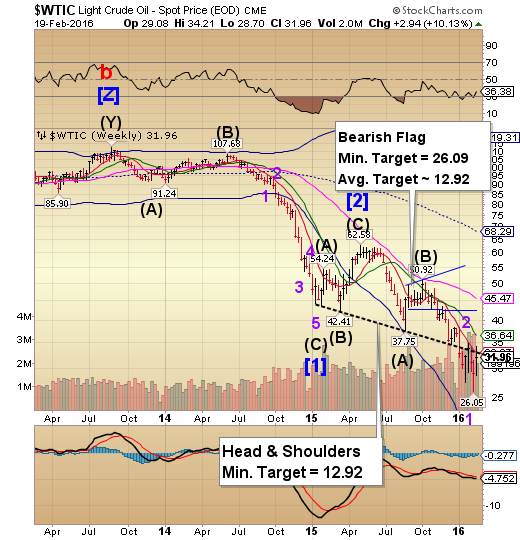
Crude attempted a third retest of the Head &Shoulders neckline and weekly short-term resistance at 32.97, but closed beneath it. Last week’s low met the minimum Bearish Flag target, but there may be a lot further to decline. Crude may resume the decline through late March, with Cycle Bottom Support continuing to fall away at 17.27, supporting this view. Analysts won’t be calling for a bottom when it finally arrives.
(CNBC) Total petroleum deliveries for January, a measure of demand in the U.S., rose 0.8 percent, to 19.4 million barrels a day, the highest January levels since 2008, API said Friday.
"The industry also produced record amounts of gasoline for the month of January that more than met rising consumer demand," Erica Bowman, API's chief economist, said in a release. "Additionally, refineries found plenty of international buyers for excess production leading to a record-setting January export level."
Motor gasoline deliveries also recorded their best January since 2007. API also said crude oil production decrease 1.4 percent in January year over year, to average 9.2 million barrels per day.
Shanghai Index rallies toward mid-Cycle resistance.
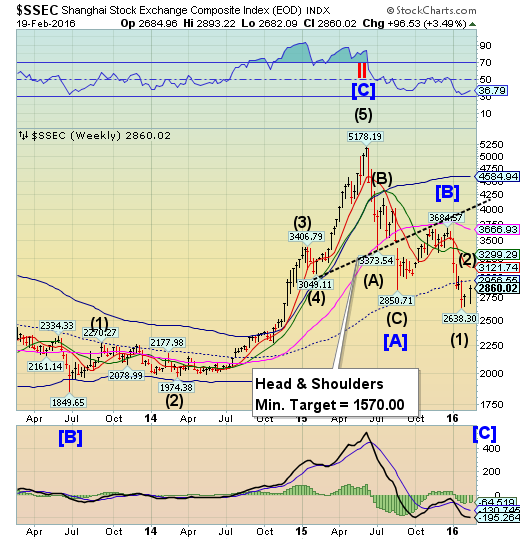
The Shanghai Index rallied toward mid-Cycle resistance last week, but the positive momentum may run out this week. A potential key pivot may be encountered this week.
(ZeroHedge) One of the more stunning economic updates this week was China's unprecedented surge in Chinese loan creation, when as reported earlier this week, China unveiled a whopping CNY3.42 trillion in Total Social Financing, its broadest debt aggregate, an amount greater than half a trillion dollars, of which CNY2.51 trillion was in new bank loans.
(ZeroHedge) China is having an exceptionally difficult time managing the narrative. What began in late 2014 as whispers about a so-called “hard landing,” escalated to a cacophony of jeers last month, when investors (rightly or wrongly) blamed volatility in China for one of the worst January's in market history.
Almost nothing has gone right for Beijing since last June when the house of cards that is the country’s equity market casino collapsed on itself following a dramatic unwind in the backdoor margin conduits that helped to channel an additional CNY1 trillion into an already frothy stock market.
The Banking Index attempts a bounce.
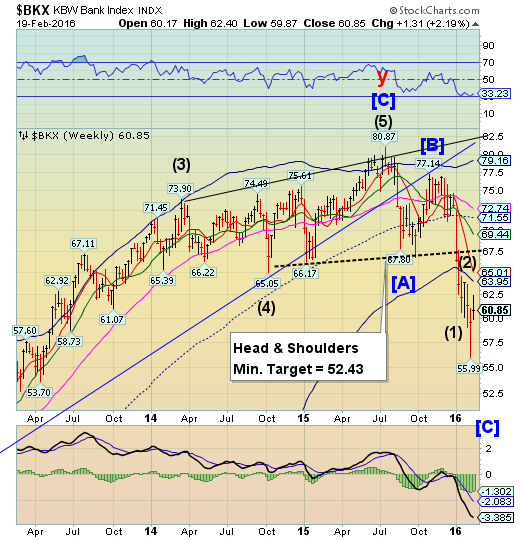
BKX bounced last week, attempting to reach Cycle Bottom resistance at 63.95. Attainment of its target is not assured. The Cycles Model suggests a probable Pivot reversal this week that may resume the larger decline.Remember, BKX is a leading index.
(Bloomberg) As banks around the world cut sales and trading jobs in an effort to reduce costs, the bloodletting in foreign exchange is proving to be among the deepest and most painful.
The world’s 12 biggest banks cut front-office currency staff by 5 percent in 2015, extending a trend that’s seen them reduce foreign-exchange headcount by more than a quarter since 2010, according to Coalition Development Ltd., a London-based provider of research and analytics for the financial industry. Layoffs among foreign-exchange traders last year outpaced those in equities, corporate finance and advisory, and fixed income, currencies and commodities trading broadly.
(WSJ) Back during the financial crisis there were many complaints that banks were holding off on writing down bad loans to create a phony picture of their financial health.
Bank executives denied doing any such thing, of course. But a newstudy has found evidence banks were understating loan-loss provisions even after the financial crisis.
This creates a double-edged danger for investors. If banks understate loan-loss provisions to boost earnings, it creates the risk of bigger write-downs in the future. And if markets don’t trust banks to properly report their loan quality, valuations will suffer.
(ZeroHedge) While Matlin Patterson's Portfolio Manager Michael Lipsky can't wait to enter the distressed junk bond space, thanks to "$74 billion in debt trading at under 25 cents on the dollar, and $205 billion trading at under 70 cents on the dollar", he agrees with BofA's Michael Contopoulos that it is still far too soon to buy. The question, according to Lipsky, is what capital structure works in the aftermath of several recent "bombs" such as Magnum Hunter which are trying to emerge from bankruptcy with negative EBITDA, and as a result both secured debt and the DIP are getting equitized.
The punchline of Lipsky's speech was that due to the persistent collapse of oil prices, the bankruptcy process has been turned on its head: "we always assume that secured lenders would roll into the bankruptcy become the DIP lenders, emerge from bankruptcy as the new secured debt of the company. But they don't want to be there, so you are buying the debt behind them and you could find yourself in a situation where you could lose 100% of your money."
(ZeroHedge) BofA's HY credit strategist Michael Contopoulos, whose work we have recently presented on several occasions, has been rather dour over the past year on the future of HY debt, as the junk bond market first descended into purgatory, and then right into the 9th circle of hell, courtesy of a collapse in the energy sector unlike anything seen in history...
... a collapse which virtually everyone admits will spread into all other sectors and products: it's just a matter of time.
However, rarely if ever have we heard Contopoulos as downright apocalyptic as he is in his latest note, "A Minsky Moment", which has to be read to be believed, if only for the selected excerpts below: (see article)
