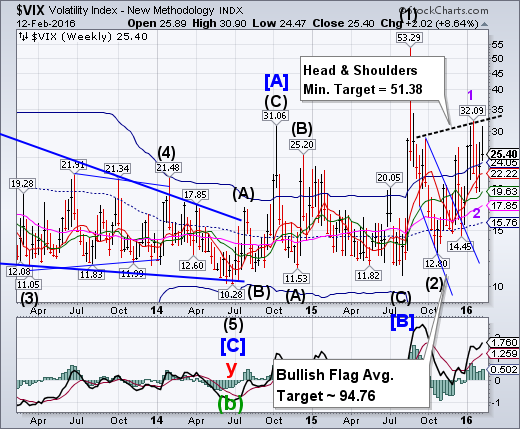
VIX rose toward its late January high at 32.09, but pulled back to close above 25.00 at the end of the week. Most market watchers take alarm when the VIX exceeds 25.00, so this week’s action is accumulative.The buy signal (NYSE sell signal) is confirmed by the Cycles Model. The close above the neckline suggests a very robust follow-through rally in the next week.
(ZeroHedge) We are on the precipice of what can only be described as a rising systemic risk for all markets. The Fed is now hinting that banks should prepare for NEGATIVE INTEREST RATES. This insanity of following the crowd is undermining the entire world economy. The increasingly unstable footing that we find ourselves standing on is reflected in widening credit spreads that demonstrate that CONFIDENCE is indeed collapsing.
SPX bounced off the neckline.
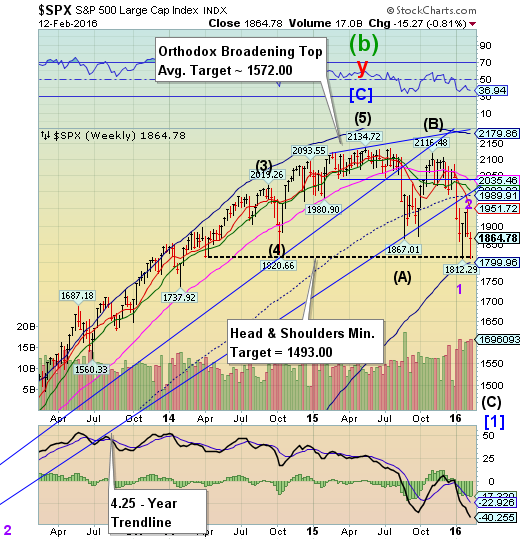
The SPX challenged its two-year Head & Shoulders neckline on Thursday and bounced. This action is keeping many investors looking for another rebound. However, the China market opens on Sunday with unfinished business on the downside, while our markets stay closed until Tuesday due to Presidents’ Day. If so, the neckline acts like an open trap door with investors trapped in their positions over a holiday weekend.
(ZeroHedge) While the S&P 500 held support at January low (1,812) yesterday (and October 2014's Bullard bounce lows), BMO's Russ Visch warns "it may not hold in the days ahead" due to weak market breadth.
Given the ongoing collapse in market breadth (now breaking well below January's lows), BMO's Visch adds...
...the probabilities still favour a breakdown in the days ahead given the continued deterioration underneath the surface in broad measures of equity participation. For example, both NYSE Advance-Decline lines (traditional and common-stock-only) have broken below their January lows.
NDX still testing the Head & Shoulders neckline.
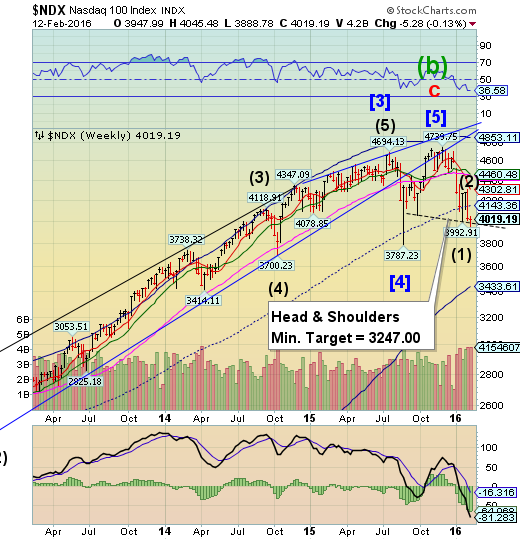
NDX also completed its retracement rally on Monday and sold off during the rest of the week. It halted just above the Head & Shoulders neckline at 3992.91. There is nothing bullish about this action. Should panic develop, NDX may decline well beneath 3000..
(Bloomberg) You may have heard technology stocks have had an ugly start to the year. But while they're battered, they still aren’t cheap.
It is true that early 2016 has been unkind to the technology market. Check out this chart of the share price to estimated earnings of the S&P 500 information technology sector index, which includes mega-to-medium companies such as Apple (O:AAPL), Google (O:GOOGL)'s parent company, Intel (O:INTC), Red Hat (N:RHT), eBay (O:EBAY) and Applied Materials (O:AMAT).
High Yield Bond Index closes flat three consecutive weeks.
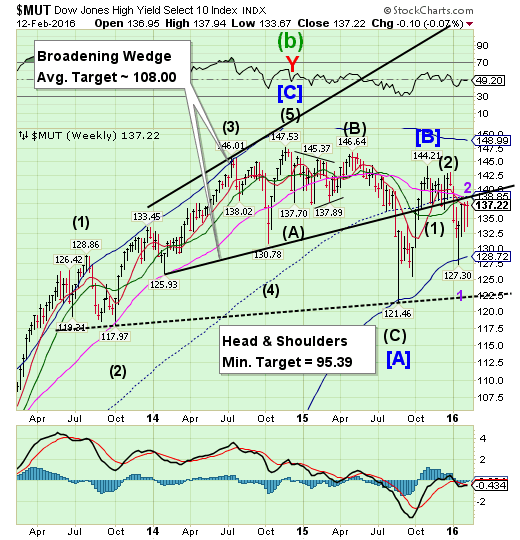
The High Yield Index closed three weeks in a row at weekly Short-term resistance at 137.22. This does not bode well for the high yield bulls as the internals are weakening. It may be ready for an imminent reversal to challenge the neckline of the Head & Shoulders formation near 122.50. MUT remains on a sell signal.
(ZeroHedge) It is becoming increasingly difficult to ignore the collapse of global credit markets... as Markit warns the number of distressed bonds (trading greater than 1000bps) is "escalating at an alarming pace."
26% of the entire high yield bond universe is now at "distressed" levels - the highest since the financial crisis.
As we noted previously, credit is screaming and for now stocks are shrugging... and credit is always right in the end!
1,100 is the target...
The euro consolidates at a new high.
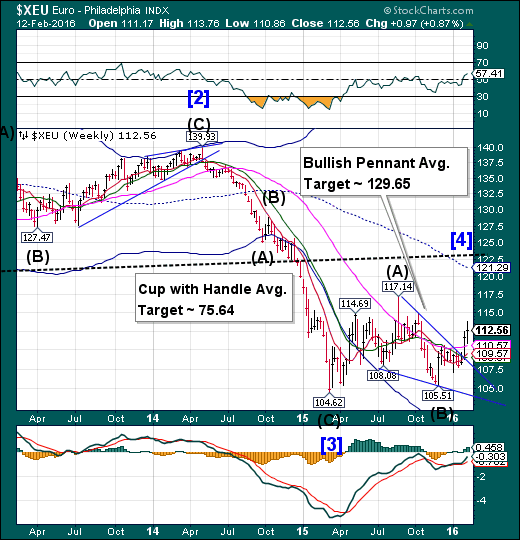
The euro consolidated above Long-term support/resistance at 110.57. The next target for this breakout appears to be mid-Cycle resistance at 121.29. The Cycles Model suggests that this may occur in the next week or so. The Bullish Pennant provides the near-term target, while the Cup with Handle formation is longer-term.
(CNBC) The euro zone economy grew by 0.3 percent in the last three months of 2015, meeting expectations, official statistics show.
Data from Eurostat showed that, year on year, the gross domestic product (GDP) for the 19 countries that use the euro grew a respectable 1.5 percent in the fourth quarter. Although that was still lower than the 1.8 percent seen in the same period by the broader 28-country European Union.
EuroStoxx challenges the Head & Shoulders neckline.
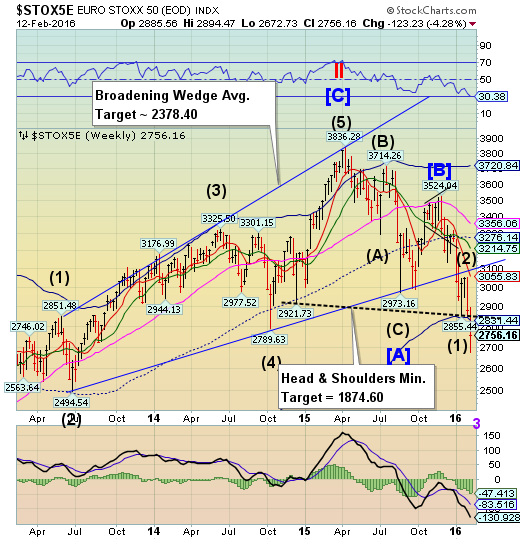
EuroStoxx stopped short of violating its Head & Shoulders neckline at 2855.44. However, there was no bounce. The decline may continue beneath the neckline and Cycle Bottom support next week. The Cycles Model suggests a panic decline may develop.
(ZeroHedge) The stock markets of the so-called PIIGS are breaking down on an absolute and relative basis – not a positive development for global markets.
The PIIGS are starting to squeal again in Europe. No, not the kind that produces pancetta or linquica or bangers. We are talking about the continent’s debt-laden, economically-challenged countries known by the acronym PIIGS, namely, Portugal, Ireland, Italy, Greece and Spain. These nations are essentially economic dead weight for Europe considering their plight. That said, all financial markets are cyclical – nothing straight-lines. And indeed, despite the apparent inevitable downfall that awaits the Eurozone as a result of the PIIGS, the associated equity markets have actually been quite buoyant for the better part of the last 4 years. Not so anymore.
The yen breaks above the Cup-with-Handle formation.
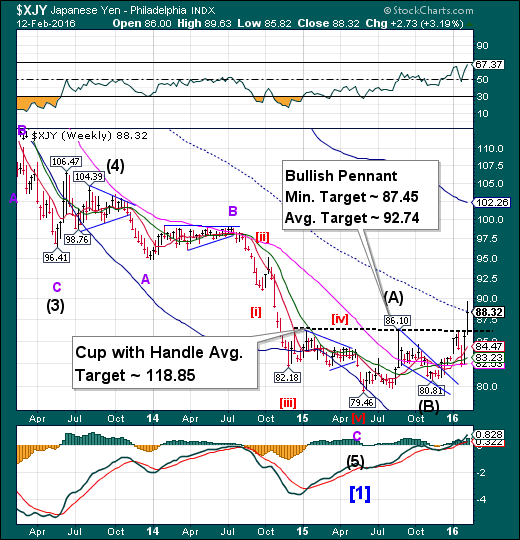
The yen broke out above the Lip of its Cup with Handle formation, also challenging its weekly mid-Cycle support/resistance line at 88.48. The immediate implication of a breakout is a probable rise to an average near 92.74 or higher. The Cycles Model suggests at least another week of strength. The (short-term) pennant target may come in a matter of weeks, while the Cup with Handle target may take more than a month.
(CNBC) Japan's descent into a negative interest rate policy should have weakened the yen, but instead it's spurring a rally as appetite for using the currency to fund other bets wanes.
The yen strengthened on Thursday to highs not seen since October of 2014, with the dollar fetching as few as 110.98 yen. That's despite the Bank of Japan (BOJ) blindsiding global financial markets on January 29 by adopting negative interest rates for the first time ever - a move that should spur outflows of the local currency, not inflows.
The Nikkei breaks the Head & Shoulders neckline.
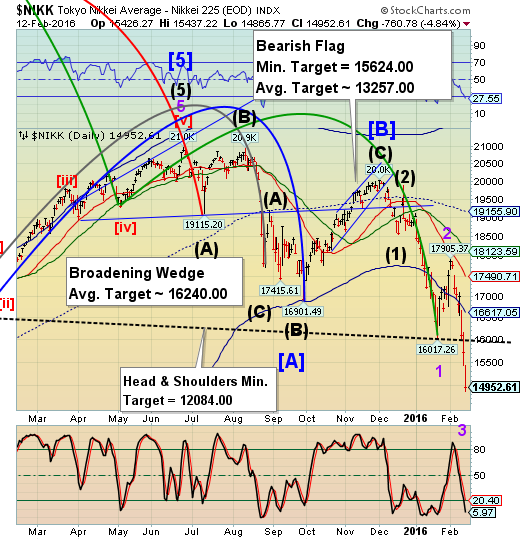
The Nikkei broke through the Head & Shoulders neckline, beginning a panic Cycle that may take it to or below 12,000.00. Last week the Cycles Model suggested, “Weakness may intensify next week.” The decline may continue with short-lived bounces along the way. Direct intervention by the Bank of Japan does not appear to have helped.
(WSJ) Japanese shares were hammered Friday, capping their worst week since the 2008 global financial crisis, as a litany of worries weighed on investors, from slowing global growth to the health of the world’s banks.
The Nikkei Stock Average finished down 11% for the week, its biggest weekly percentage drop since October 2008. For the day, the index ended off 4.8% at 14,952.61, the lowest since October 2014.
U.S. dollar fails at retest of Long-term support.
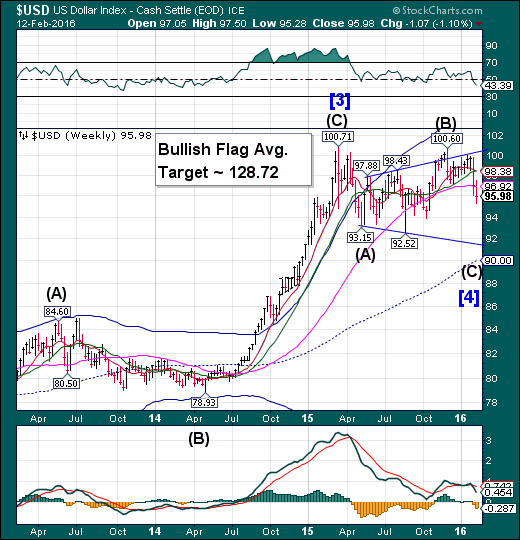
After a challenge of the Long-term support/resistance at 96.92 the US dollar fell to a new Cycle low before a bounce. The Cycles Model calls for a fast decline, possibly falling as far as the lower trendline of the Broadening formation. Bullish speculators have been caught the wrong way in their positions, causing a panic among the longs as this decline has the potential of wiping out all 2015 gains.
(Reuters) Speculators reduced bullish bets on the U.S. dollar for a seventh straight week, with net longs dropping to their lowest level since mid-July 2014, according to Reuters calculations and data from the Commodity Futures Trading Commission released on Friday.
The value of the dollar's net long position plunged to $12.60 billion in the week ended Feb. 9, from $18.20 billion in the previous week. Net dollar longs came in below $20 billion for a second straight week.
The outlook on the dollar has soured since the beginning of the year as a global stock market meltdown and a plunge in oil prices have increased volatility across all asset classes, which could further slow the Federal Reserve's tightening policy.
USB gaps to its Cycle Top.
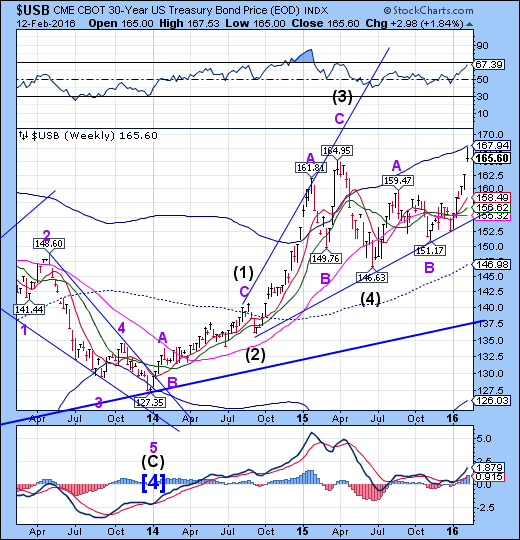
The Long Bond gapped higher on Wednesday as it surged to its cycle Top resistance at 167.94. The pullback may already be complete with at least one more probe to or above the Cycle Top. After that, we’ll be looking for the 34.4-year high in Treasuries.
(MarketWatch) Treasury prices fell sharply Friday, pushing yields sharply lower, as a rebound in risk assets — mainly global stocks and oil — led investors to sell safer ones.
Treasury yields had been tumbling for the previous six sessions, plunging to an intraday 3½-year-low on Thursday, as investors fled stocks and turned to so-called haven assets, namely government bonds and gold, amid a global rout in equities and oil.
Gold in a sling-shot retracement.
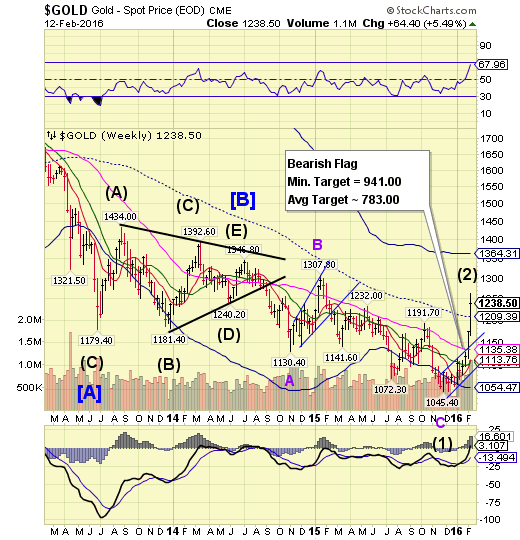
Gold performed a rapid sling-shot retracement in a throw-over of an Ending Diagonal. However, Ending Diagonals are completely retraced, leaving this move as a false breakout. A decline beneath mid-Cycle support at 1209.39 may signal a change in trend. Gold may be in for a very deep sell-off by the end of the month. Investor emotions are running high.
(Reuters) Gold eased on Friday after soaring 4 percent the previous day, but was still set for its best week in four years, lifted by stock market turmoil that has sent investors rushing for safe haven assets.
Spot gold XAU was down 1 percent at $1,234.30 an ounce by 1423 GMT, but has still risen more than 5 percent this week, the biggest weekly gain since October 2011.
"Gold could test $1,260 or even $1,300 in the next few weeks, but I wouldn't be surprised if we also see some profit-taking," said Commerzbank (DE:CBKG) analyst Carsten Fritsch.
Crude is making new lows...
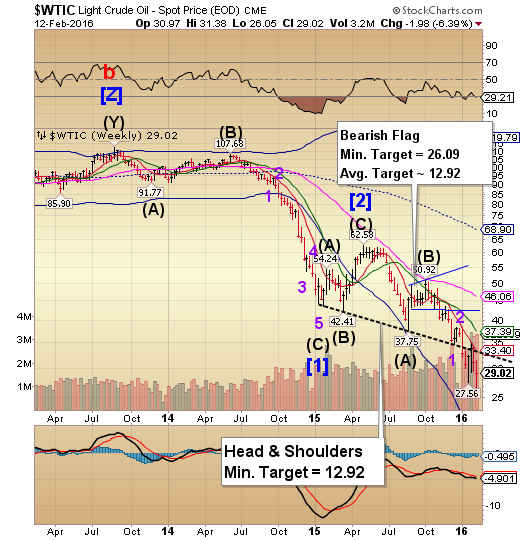
Crude attempted a retest of the Head &Shoulders neckline and weekly short-term resistance at 33.40, but failed. It has since made a new low, meeting the minimum Bearish Flag target. Crude may resume the decline through the end of February, with Cycle Bottom Support continuing to fall away at 18.00, supporting this view. Analysts won’t be calling for a bottom when it arrives.
(DallasMorningNews) Crude oil surged the most in seven years on Friday, rebounding from its lowest point in more than a decade.
A day after sinking to its lowest level since May 2003, benchmark U.S. crude climbed $3.23, or 12.3 percent Friday, to close at $29.44 a barrel in New York. Brent crude, a benchmark for international oils, gained $3.30, or 11 percent, to $33.36 a barrel in London.
The oil rebound sent the S&P 500’s energy companies 2.6 percent higher. Marathon Oil (N:MRO) was the best performer in the sector, rising 48 cents, or 6.8 percent, to $7.49.
Shanghai Index returning from the holiday.
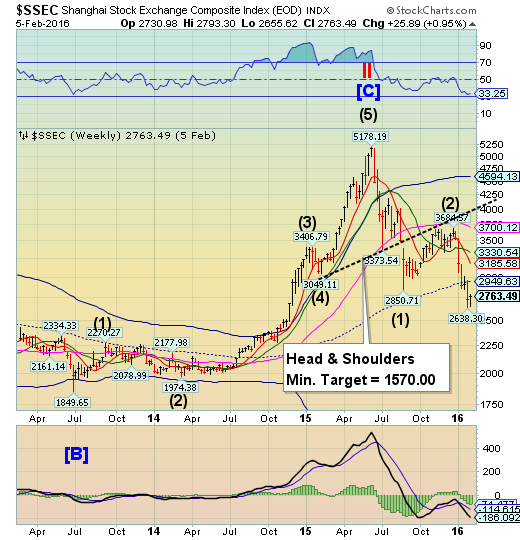
The Shanghai Index went inert as the people of China the week-long Chinese Spring Festival and the Chinese New Year.The Chinese exchanges will open on Sunday with a potential yuan devaluation and resumption of the decline. A potential intermediate low awaits in the last week of February.
(ZeroHedge) After repeated warnings about China's soaring non-performing loans on this site, which have underscored the basis of Kyle Bass' "big trade for 2016", namely shorting China's currency in the bet it will have to massively devalue in order to address its incipient default cycle, virtually everyone is aware that China has a big Non-Performing Loan problem, a problem whose size we first quantified as much as $3 trillion, or the same amount as all of China's FX reserves.
However, very few know that while the rest of the world is assuming that China will simply sit there and hold in its imploding NPLs which could well rip it apart from the inside in a massive wave of defaults, some of these bad loans have quietly found their way to the US, where they hope to find a buyer courtesy of the DebtX platform.
The Banking Index is in a strong downdraft.
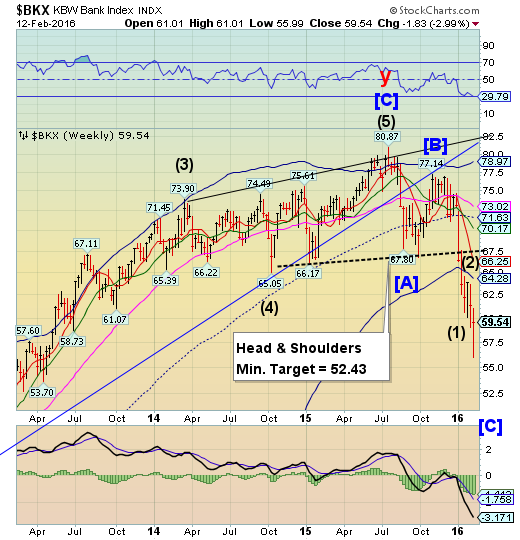
BKX is in a strong downdraft beneath its Cycle Bottom resistance at 64.28. The Cycles Model appears to be taking its cue from the long Bond, suggesting at least another week of decline before a significant bounce. Remember, BKX is a leading index.
(Barrons) Bloodletting in the European banking sector may not be over despite last week’s brutal selloff.
There is still a heap of uncertainty in the market, even though the bank subsector of the Stoxx Europe 600 Index last week tumbled nearly 11%, taking losses for the year to more than 28%.
Fears that regulators could require banks to raise fresh capital to ensure they have adequate reserves to protect against future shocks—and worries about the ability of lenders to grow earnings—could continue to weigh on the sector, which has been the worst performer in Europe so far this year.
Complicating the situation, negative interest rates in the euro zone mean that it is increasingly difficult for banks to make money. With the European Central Bank next month possibly pushing rates even deeper into negative territory, the outlook for lenders isn’t going to get any easier. “Earnings expectations are too high and have to fall,” says Dirk Becker, a banking analyst at Allianz (DE:ALVG) Global Investors.
(ZeroHedge) Following this morning's proclamation by Deutsche Bank (DE:DBKGn) co-CEO John Cryan that Germany's largest bank is "rock solid," David Stockman exposed the ugly truth that everyone appears to have forgotten from just 7 years ago...
"in my experience is that when the crunch comes, bank CEOs lie"
Stockman details the Morgan Stanley (N:MS), BofA (N:BAC), Lehman, and Bear Stearns bullshit that occurred before exclaiming...
"I don't trust Deutsche Bank. I don't trust what they're saying. And there's reason why the banks are being sold all across the world... because people are realizing once again that we don't know what's there [on bank balance sheets]."
(ZeroHedge) Deutsche Bank (N:DB) stock is ripping 10% higher after confirming old news that it will undertake a modest debt buyback of $2 billion and €3 billion (not including the CoCos). Have no fear though as Wolfgang Schaeuble proclaimed Deutsche Bank is a "strong bank" that is "resilient" and "well positioned."
Back to the start of the week...
(ZeroHedge) The buzz surrounding the late-afternoon bounce in stocks yesterday revolved around the news that Jamie Dimon was buying 500,000 shares of JPMorgan Chase (N:JPM) stock. As Dana Lyons notes,
Some folks surmised that it was an act of desperation in hopes of arresting the brutal slide in the bank’s shares – and the stock market, in general. Examining the chart of the KBW Bank Index (BKX), however, we wonder if A) the purchase wasn’t shrewdly timed and B) Mr. Dimon has a technical analyst advising him on his shares purchases.
(Bloomberg) Fresh concerns about the financial industry swept through markets this week as global stocks ended a five-year bull run, with banks supplanting oil drillers as the biggest drag and sending the Standard & Poor’s 500 Index to its second straight decline.
Even after the biggest rally in two weeks on Friday, the benchmark gauge for American equity slid 0.8 percent over the five days, extending its February loss to 3.9 percent. Financial stocks fell to a 2 1/2-year low on Thursday as investors sold their most credit-sensitive assets.
Goldman Sachs Group Inc (N:GS)., Morgan Stanley and Bank of America Corp (N:BAC). dropped 5 percent or more for the week as an index of financial shares in the S&P 500 extended a retreat that has erased more than a quarter of its rally since March 2009. Since the last bull market in American stocks ended in October 2007, banks remain down more than 40 percent -- by far the worst group in the S&P 500.
