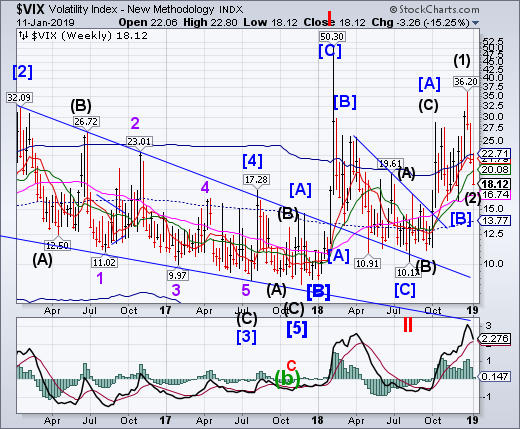
VIX declined beneath weekly Intermediate-term support at 20.08, making a new Master Cycle low on Friday. The Cycle low put a new outlook on the Model, suggesting that these moves may be at a higher degree Cycle than originally thought.
(Bloomberg) Wall Street’s “fear gauge” is defying the recent market swoon.
The Cboe Volatility Index, known as the VIX, has fallen eight of the past 10 trading sessions, closing at 19.98 on Wednesday compared with 36.07 on Dec. 24. That’s at odds with large realized swings in U.S. stocks -- a potentially unsustainable divergence.
“Market internals imply a VIX of 31 based on trailing realized volatility and five-day SPX returns,” UBS Group AG strategist Stuart Kaiser wrote in a note about the gauge’s fair value. “60-day realized volatility above 25 percent is the largest driver of that estimate.”
SPX meets strong resistance
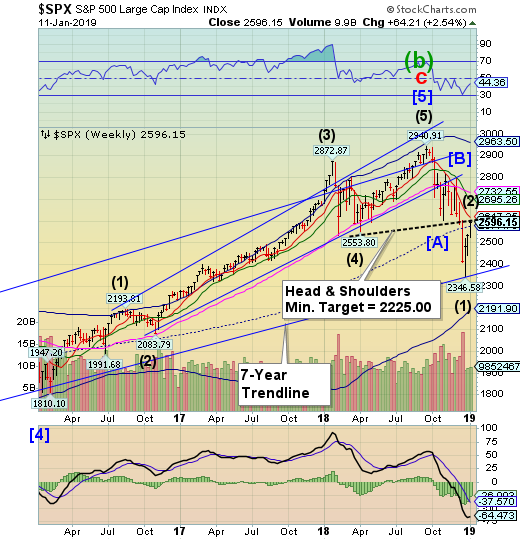
SPX continued its rally up to its Head & Shoulders neckline at 2595.00 and Short-term resistance at 2617.36, where it bogged down in the latter half of the week. These are the critical tests that it must pass to remain bullish. The media is upbeat, but the SPX is not out of the woods.
(Bloomberg) If there’s a silver lining for Main Street investors in the stock market turmoil of the past few months, it’s this: They now have a far more realistic idea of how much risk they’re willing to take—and a new appreciation for what portfolio diversification means.
The plunge in the S&P 500 late last year, 19.8 percent from its September high to its December low, wasn’t quite enough to meet the traditional definition of a bear market (unless you’re rounding up). And stocks have climbed back more than 9 percent since. Still, after a very long bull market, fear of missing out has suddenly morphed into worry about years of fat gains melting away. Some investors are taking a serious look at the risks in their portfolio for the first time in a while. Financial planners see it in their offices. “Our highest client acquisition periods are when the markets are getting murdered,” says Lou Stanasolovich, president of Legend Financial Advisors. “We live for this.”
NDX meets Short-term resistance
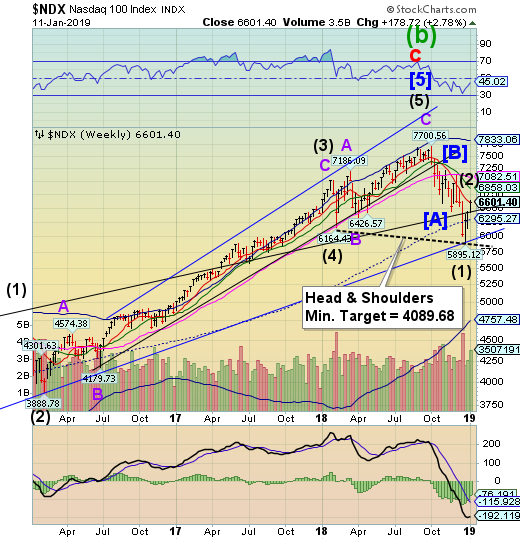
Nasdaq 100 broke through a trendline to meet up with weekly Short-term resistance. The Cycles Model suggests that NDX is either at or very near the end of its rally. There is a potential Head & Shoulders formation that, if triggered, may erase up to 3 years of gains. Stay tuned!
(Bloomberg) Technology stocks have seen solid gains since tumbling to a 15-month low late last month, but investors aren’t convinced that that low represents a bottom for the sector, which has been volatile amid questions over growth and valuation.
The S&P 500 information technology index is up 10 percent since the close of trading on Dec. 24, when it ended at its lowest since September 2017.
Among notable gainers over the same period, Nvidia Corp. has risen 17 percent, Advanced Micro Devices (NASDAQ:AMD) has climbed 22 percent and Oracle Corp (NYSE:ORCL). is up 13 percent. The moves have been even more sizable when it comes to some of the market’s most closely watched Internet stocks. Netflix Inc (NASDAQ:NFLX). is up more than 40 percent over that period, while Amazon.com Inc (NASDAQ:AMZN). has rallied 22 percent and Facebook Inc (NASDAQ:FB). has risen 16 percent. All of these, however, remain decisively below record levels.
High Yield Bond Index tests Short-term resistance
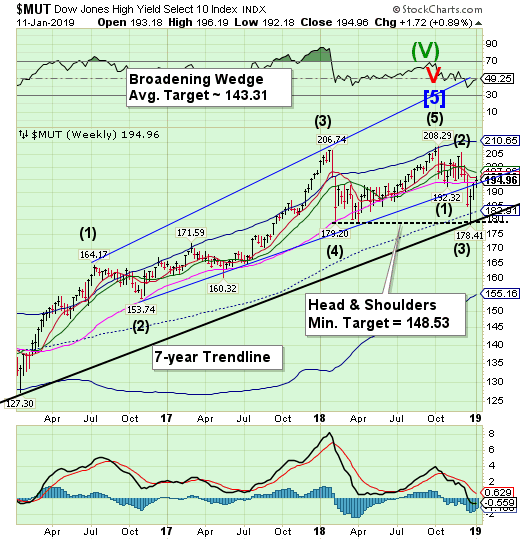
The High Yield Bond Index managed to rally above Long-term resistance at 194.25 only to challenge Short-term resistance at 195.82.MUT is not on a sell signal above Long-term support/resistance and the trendline. The retracement rally may have played out after more than two weeks of gains. The 7-year Trendline is coupled with a potential Head & Shoulders formation that may give us the final outcome if triggered.
Treasury bonds fall back beneath the mid-Cycle resistance
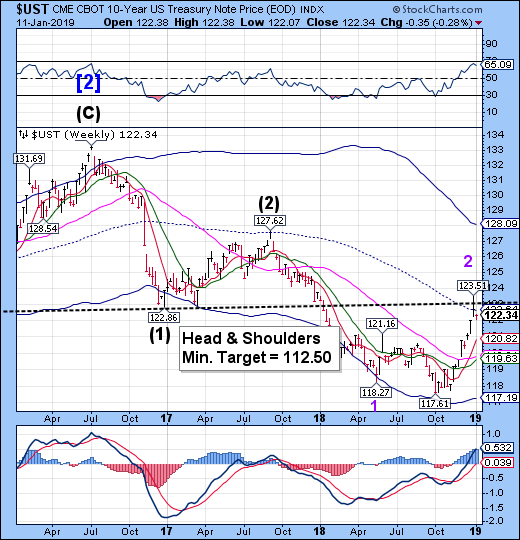
The 10-year Treasury Note Index challenged the Head & Shoulders neckline at 123.00 last week. However, it closed beneath mid-Cycle resistance at 122.64, suggesting a possible new sell signal, leaving the formation in place. If correct, a decline in UST may develop, lasting through early February. The article below gives an alternate view.
(Bloomberg) In a positive technical sign for bond bulls, the U.S. 10-year Treasury yield is heading for a so-called death cross pattern.
It occurs when the 50-day moving average crosses below its 200-day counterpart. While many traders are skeptical of its import, others argue it presages further weakness in the benchmark yield.
“These crosses are compelling developments when it comes to the yield on the U.S. Treasury note,” wrote Miller Tabak + Co. equity strategist Matt Maley, in a note to clients. “It should indicate long-term yields will continue to head lower as we move through the first quarter.”
The euro breaks above its trading range
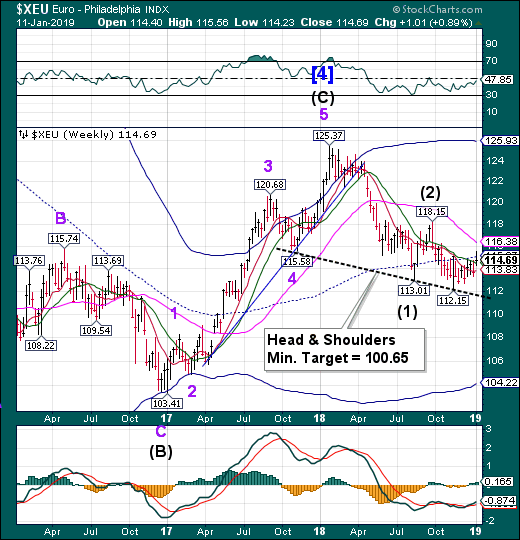
The euro broke out of its trading range to challenge mid-Cycle resistance, closing beneath it. It may have nullified the sell signal, but at best we might say it is neutral. There is a potential Head & Shoulders formation beneath 112.00 that suggests a downside target.
(Reuters) - The dollar rose against the euro on Friday in choppy trading, boosted by technical factors after the single currency hit key resistance levels, even as the greenback's outlook remained bleak amid cautious signals from the Federal Reserve about further rate hikes.
"It seems like we're getting some model and stop-loss buying on the dollar after the euro hit resistance on the upside," saidJohn Doyle, vice president of dealing and trading at Tempus Inc.
in Washington.
"I don't see any fundamental driver to this move. The sharpest move was in euro/dollar and it has become this across-the-board buying of the dollar," he added.
That said, investors remained wary of pushing the dollar a lot higher.
Euro Stoxx meets resistance
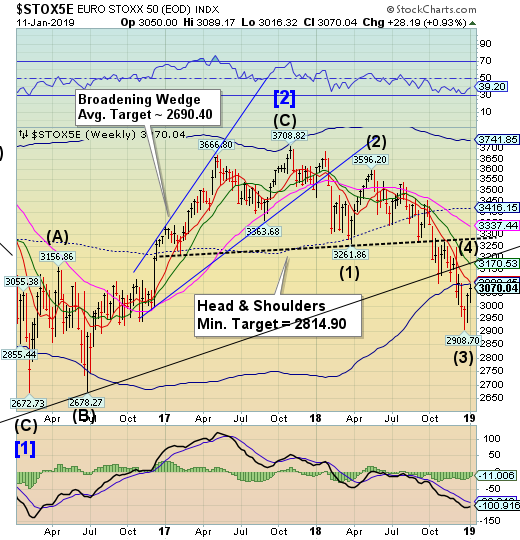
The Euro Stoxx 50 rallied to Cycle Bottom resistance at 3090.45 on Wednesday and appears to have stopped. The Cycles Model suggests Cyclical strength may run out over the weekend, with the weakness to follow through the end of the month.
(CNBC) Stocks in Europe saw little change on Friday, as investors tried to navigate through political uncertainty across the globe.
The pan-European Stoxx 600 was basically flat at the end of the session, with sectors and bourses pointing in different directions.
Autos were the worst performing sector, as former Nissan Motor Chairman Carlos Ghosn was indicted on two new charges of financial misconduct. Shares of Renault (PA:RENA), which Ghosn still heads, fell 2.2 percent as Reuters reported that Nissan was expanding its probe to include dealings that took place in the U.S., India, and Latin America.
The yen is repulsed at the Cycle Top
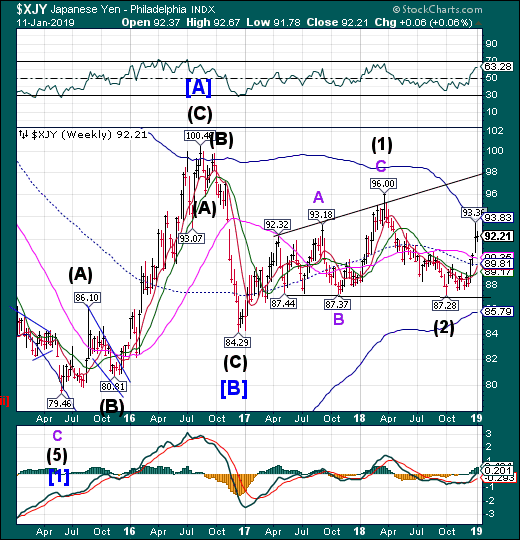
The yen consolidated beneath its Cycle Top resistance at 93.83 in what may be a pullback to Long-term support at 90.35. However, the Cycles Model suggests a continued probe to the upper trendline by the end of the month.
(Bloomberg) Fund managers are warming to the idea of the yen strengthening as far as 100 per dollar, but only if there’s a global economic downturn.
The yen started the year with a bang, rallying close to 4 percent versus the dollar in a flash move in thin holiday trading last week, and the market sees room for further gains. Deutsche Bank AG (DE:DBKGn) has issued a year-end target of 100 per dollar, a level last touched in 2016, while Russell Investments Ltd and Credit Agricole (PA:CAGR) SA see that reached in 2020.
Nikkei makes up losses
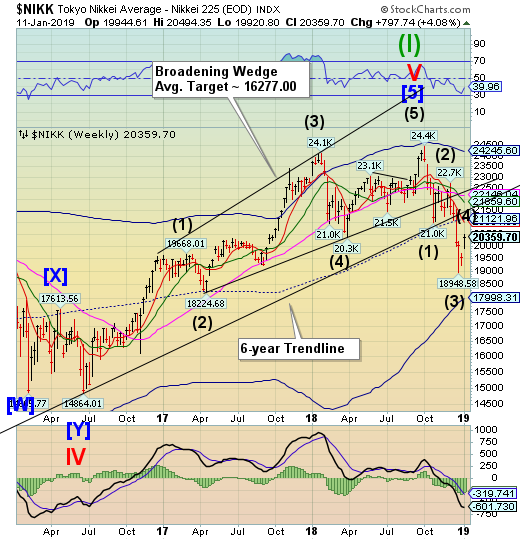
The Nikkei made up more of the losses suffered in December, but may also be running out of steam. The Cycles Model remains neutral for next week but turns down soon after. Usually, a bounce like this may last two to three weeks. It may be running out of time.
(Reuters) - Japanese stocks rallied on Friday, tracking strong U.S. shares and overcoming falls by convenience stores which reported dismal quarterly earnings the previous day.
Olympus Corp was in the spotlight in the afternoon, jumping 9.9 percent to a near three-month high after the medical equipment and camera maker said it would propose giving U.S. hedge fund ValueAct Capital, the biggest shareholder, a board seat.
The Nikkei share average rose 1.0 percent to 20,359.70. For the week, it added 4.1 percent, the biggest weekly gain in more than two months.
Helping the Nikkei moved back above 20,000 has been hopes of a U.S.-China trade deal, which tempered worries over global growth.
U.S Dollar Tests long-Term Support
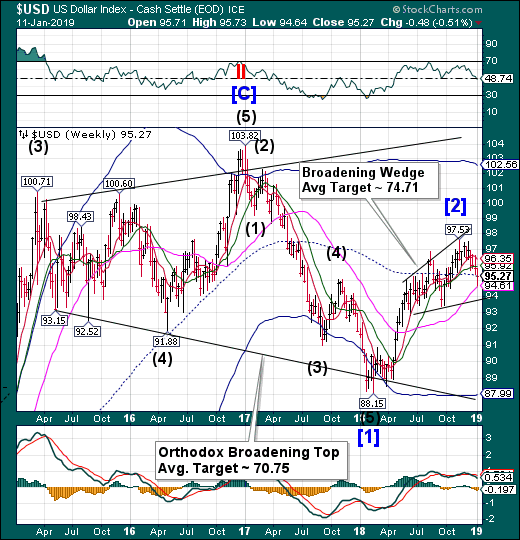
USD declined to test Long-term support at 94.61 before bouncing back to mid-Cycle resistance at 95.27. The USD remains on a sell signal. The Cycles Model suggests weakness for the next 3 weeks.
(MarketWatch) The U.S. dollar on Friday flipped into positive territory against many of its rivals in the aftermath of December consumer-price inflation figures. One exception was the British pound, which defended its strength after U.K. newspaper The Evening Standard reported that a delay to the March 29 Brexit was becoming increasingly likely.
The buck started the session on the back foot but managed to climb after December consumer-price inflation data was released even though it showed CPI to drop for the first time in nine months on the back of lower gas prices. Still, the ICE (NYSE:ICE) U.S. Dollar Index DXY, +0.12% moved up 0.1% to 95.624.
Gold consolidates under 1300.00
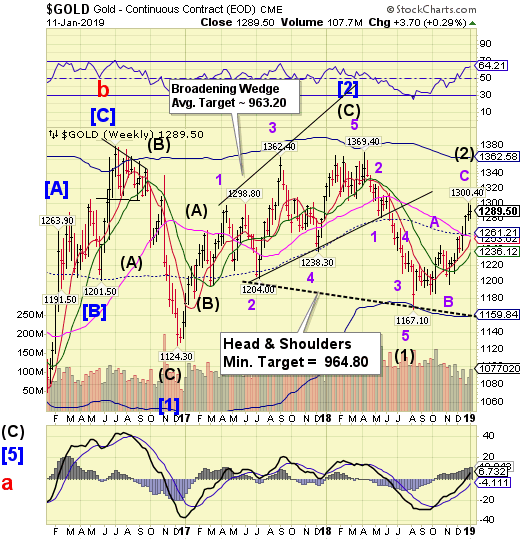
Gold consolidated in an inside week beneath 1300.00. The right shoulder of a potential Head & Shoulders formation is complete and the reversal may have begun. The Head & Shoulders formation matches targets with the already existent Broadening Wedge formation.
(Reuters) - Gold rose on Friday as the dollar slipped on expectations that brakes could soon be applied to U.S. interest rates, putting the non-yielding metal on track for a fourth straight weekly gain.
Spot gold rose 0.4 percent to $1,292.01 an ounce by 1320 GMT. U.S. gold futures were up 0.4 percent at $1,292.90.
The dollar slipped against other major currencies, impaired by Fed Chairman Jerome Powell’s comment that the central bank could be patient on rate policy.
“Gold rose on a somewhat weaker dollar, but at the moment it seems to be trying to overcome the $1,300 hurdle,” said Commerzbank (DE:CBKG) analyst Daniel Briesemann.
Crude challenges Short-term resistance
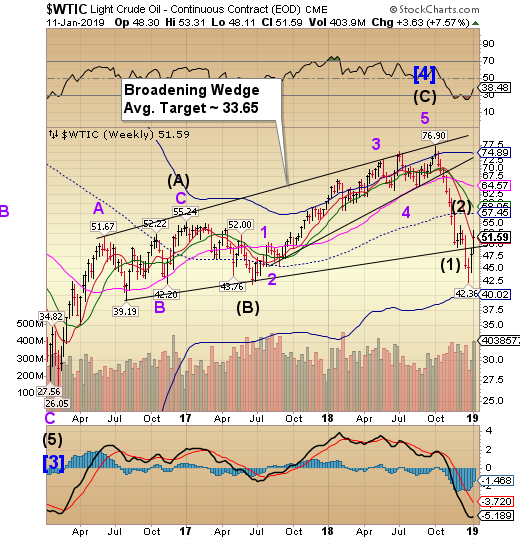
Crude Oil rallied above the Broadening Wedge trendline, challenging Short-term resistance at 51.25. It may be on time for a reversal since it had hit peak strength on Friday. The decline may resume as early as next week through the end of January.
(RigZone) Since Jan. 2, the first trading day of 2019, crude oil prices have consistently risen day-on-day. That winning streak ended Friday.
West Texas Intermediate (WTI) crude oil for February delivery lost $1 Friday, settling at $51.59 per barrel. Despite Friday’s dip, however, the WTI is up 7.6 percent against the Jan. 4 settlement. The benchmark traded within a range from $51.18 to $53.31 during Friday’s session.
The March Brent crude oil contract, which fell $1.20 Friday, ended the day at $60.48 a barrel. For the week, the Brent is up 10.1 percent.
